


In our real-time delivery logistics system, the environment, behavior of Dashers (our term for delivery drivers), and consumer demand are highly volatile. Because small changes to the decision-making process of matching deliveries to Dashers can cause a cascade of different assignment decisions, it is difficult to determine the expected outcome of any algorithm iteration or product change. All of this makes it hard to determine the impact of any change via offline sizing or analysis. On DoorDash’s Assignment team, we adopted an experiment-driven framework to determine the outcome of any change with scientific precision and run this analysis at scale.

Because experimentation drives our product development, ramping up our experimentation velocity is critical to sustaining the growth of our business. The Assignment team has been able to grow experimentation volume by over 1000% in the last three years (Figure 1). At the time of writing, we run about one thousand experiments per year, including 30 concurrently running switchback experiments, which make up to 200,000 QPS of bucket evaluations. We will discuss the challenges we faced initially and the characteristics of the system we built to scale our experiments.
The challenges inherent in scaling experimentation
Behind the hypergrowth of ramping experimentation, we have overcome a variety of challenges and made improvements over time. The challenges we faced include:
Failure aversion
In data science, a field with many high-achieving individuals, there is an aversion to failure. A team that does not celebrate failure and the lessons learned from it will likely be less productive. At DoorDash, we accept failure, as 95% of experiments are bound to fail initially. Therefore, we needed to build a culture that would embrace failure so we could learn from mistakes and improve on each iteration.
Lack of an effective decision-making process
Large teams make the process of reviewing experiments at scale challenging. At DoorDash, we needed a way to manage 25-plus weekly experiments during short meetings with many stakeholders.
Creating effective experiment methodologies is complex
Experiments with strong network effects are difficult to analyze and set up. Because experiments might affect Dasher behavior and the low sensitivity of switchback experiments, we needed statistical methods and an experimentation design that allowed us to run many concurrent experiments, measure network effects, and use variance reduction to speed up experiments
Ad hoc analysis doesn’t scale
Before platformization, experiment owners used one-off SQL, Python, and R notebooks for experiment analysis, which were prone to human error and took a lot of time to build. We needed an experimentation platform where we could automate the process of setting up a new experiment. Not only would this help us standardize our experiment results, but would also make analyzing experiment data much faster.
Subscribe for weekly updates
How we scaled our experimentation 1000%
In order to scale our experiment capacity we focused on building an approach with the following four attributes:
- Operating with a fail-fast to learn-fast culture
- Building a scalable experimentation process
- Using optimal statistical methods
- Building a customizable and automated experimentation platform and tooling
Let’s go through each pillar to illustrate how these all came together to increase our experiment capacity.
Developing a fail-fast to learn-fast culture
At the heart of implementing effective experimentation is building a culture that has the right mindset for success. Often experimentation is bogged down by members trying to use experiments to validate their point of view rather than using the data to help them better understand the problem space. To build this culture, we emphasized the following values to ensure our team focuses on what's most important when running experiments:
- Failing fast and learning fast
- Operating at the lowest level of detail
- Having intellectual honesty and humility
Failing fast to learn fast
In order to facilitate rapid learning, we must accept that failure is common. As a team, we should embrace and expect failure, under two conditions:
- We should always aim to fail fast
- We should try and fail forward, and learn from every failure so that each experimental hypothesis is better than the last one
By embracing these conditions we aim to get a signal as fast as possible and turn off experiments as soon as we collect enough data to conclude what happened and execute the next steps. As we enable ourselves to fail faster we can learn faster and reduce the time it takes to get more impactful results.
Understand the problem space at the lowest level of detail
At DoorDash the single most important input into our product development is an improved understanding of our problem space. Every day we seek to better understand the millions of deliveries completed per day, the meaningful differences across delivery types or regions, and the areas where DoorDash logistics currently falls short.
Experimentation allows us to do all of this. When we want to learn something, we form a hypothesis, test it, and then analyze where we were wrong and where we were right. Most experiments do not succeed in improving our dispatch engine, but they all build on our detailed understanding of our system. Any improvement of our experimentation approach improves our understanding of how logistics work.
Encouraging Intellectual honesty and humility
Learning quickly through experimentation can be a humbling experience: a good week often reveals that our team was completely wrong about a number of past assumptions. It is not uncommon for a new experiment to invalidate a message we were sharing externally only a week prior. Due to the nature of our work, assumptions are constantly changing, leaving little room for perfectionism or fear of failure.
Those of us who have worked on the Assignment team for a while have come to expect this: today, we are wrong about many things, we just don’t know what they are yet. In our experimentation process, it’s important to be able to let go of assumptions. When the data tells us something counter to previously held notions, we give the data an honest read, and change perspectives accordingly.
Building a scalable experimentation process
Our experimentation process has scaled massively over the last three years. In 2018, we’d run around ten experiments during a typical month. In June 2021, we ran over 100. In order to ensure these experiments are trustworthy at our rapid speed, the Assignment cross-functional team has been iterating and optimizing the experiment launch and review process over time and built improvements like:
- Standardized experimentation metrics
- A two-filter system
- Weekly experiment cadence
Standardizing experiment metrics and shipping criteria, in advance
Well-defined metrics and standardized shipping criteria are critical to running a high-velocity process. We have three categories of these metrics: goals, guardrails, and diagnostic metrics.
- Goal metrics are the North Star the team strives to improve week over week (specifically, the Assignment team looks at Dasher active time per delivery, and delivery duration times).
- Guardrail metrics are metrics that we do not actively seek to improve but want to ensure do not degrade.
- Diagnostic metrics are input metrics that help each experiment owner interpret behavioral changes of the system to iterate their experiments. For example, the delivery duration can be broken down into smaller components (e.g. the Dashers’ travel time to the store and wait time at the store) to help the experiment diagnosis and investigation.
Every type of metric is calculated using a centralized experimentation analysis system and can be compared and prioritized.
In order to release an experiment we need to define our Goal and Guardrail metrics. These metrics let us measure our experiments against business priorities, and our success metrics are kept as stable as possible (only changing when we adjust our product roadmaps or business priorities). Standardized metrics let experiment owners make decisions faster and independently, which speeds up the experimentation process.
Using a two-filter system for optimizing limited sample sizes
Switchback experiments, the most common deployed on our team, have relatively low power, meaning there is a higher chance our new feature will seem to make no impact when it actually did (essentially we are more likely to have a type II error). To mitigate the low power factor we need to run the experiment in large regions, which means we need as much experiment parallelization as possible. Using parallelization to run multiple experiments in tandem also allows for greater experiment velocity since we can run more at the same time without reducing power. However, when the volume of experiments grows too large, we find that the potential interaction between experiments cannot be ignored. As a result, we have tested and simulated several versions of factorial designs which try to balance these interactions and remove bias.
After several iterations, we gave up on the most complicated factorial designs model and decided to adopt a two-zone system that requires less overhead management and human input. In this two-zone system, every window, split by region and hour, is randomly classified into either zone 1 or zone 2. In both zone 1 and zone 2, we have multiple layers, and each layer can have one or more experiments. Each week, we limit the number of layers in zone 2 to three so that we can measure interactions efficiently between experiments with high confidence.

Zone 1 serves as a preliminary filter to select good candidates. Experiments running in zone 1 that meet our success metrics then move on to zone 2 for further testing. Zone 2 results are used to validate the Zone 1 results and make shipping decisions. Having this second filter not only limits the interactions between candidate experiments to be shipped but also avoids shipping experiments based on one week of data.
Setting up a weekly experiment cadence
Before we had a fixed experiment cadence, each experiment owner launched experiments on their own schedule. When the number of experiments increases, the overhead of coordination between experiment owners, the time spent on product reviews, and the risk of engineering reliability also dramatically increases. A weekly experiment cadence is at the center of our experimentation process and ensures that the execution of experiments is seamless and well organized. Our experiment cadence facilitates seamless collaboration between the engineering team, product team, and experiment owners.
Our experiment cadence process:
- Early in the week, the experiment owner reviews the experiment results and makes decisions on the next steps of the experiment based on the metrics and shipping criteria.
- In the middle of the week, our product manager hosts a centralized review to coordinate the next steps for all experiments. During the experiment review, the team reviews the zone 2 experiments that should be shipped; the zone 1 experiments that should be promoted into zone 2 in the next week; and any new experiments that should be launched. People in the cross-functional team normally call out possible risks (e.g. interactions between experiments) and take steps to mitigate those risks.
- Later in the week, the engineering team implements the experiments, deploys experiments to production, and enables the experiments. After deployment, the engineering team closely monitors the experiment results and takes actions to make sure the production and quality metrics are healthy.
- After experiments are launched, each experiment owner will set up their analysis results in our experiment analysis platform.
Our weekly cadence is designed to give each experiment owner full control of the experiment and the ability to iterate swiftly. The review process can also help make sure that the experiment shipped is consistent with our product roadmap.

Overall our process ensures that:
- The product team is able to communicate with each individual experiment owner and understand the status so they can track the delivery of the features they own.
- The progress of experiments is more easily shared within the team.
- The deployment of each experiment is correctly delegated and is not tedious or time-consuming.
- Each experiment owner can be more disciplined about maintaining experiment timelines.
- The engineering team can closely monitor and mitigate the risk of experiments’ impact on the reliability of the system
Using optimal statistical methods
Part of building a scalable experimentation platform is creating a set of reliable statistical methods that will ensure experiments are accurate and reliable. Because we have a lot of network effects we need to create specific statistical methods to ensure that the switchback experiments we run are effective. After a number of iterations, our team was able to identify a set of statistical methods that performed best on our experiment setting. It is worth mentioning that our partnership with academics at Stanford University has provided us with many insights, guidance, and confidence.
Why switchback experiments are especially hard to deal with
In the assignment world, there is a strong network effect because we seek to match deliveries to Dashers in a region. As a result, traditional delivery-level A/B testing violates Stable Unit Treatment Value Assumption (SUTVA). For example, giving higher priorities for deliveries in treatment will delay the assignment of deliveries in control, because the treatment and control deliveries share the same Dasher pool. For most experiments, we rely on switchback experiments, which mitigate the violation of SUTVA by using region and time window combinations as the randomization unit, so the treatment and control groups will be separated.
Given the experimentation setup, the randomization unit (time window, region) is usually coarser than the analysis unit (delivery, which means our metrics are calculated at the delivery level). The analysis can easily get into a trap of not adjusting for the cluster, which leads to underestimated standard error. As a result, the false-positive rate can be at least 70% from our simulations. We need more sophisticated methodologies to analyze the result, such as cluster robust standard error, bootstraping, or the Delta method.
Optimizing our switchback experiments
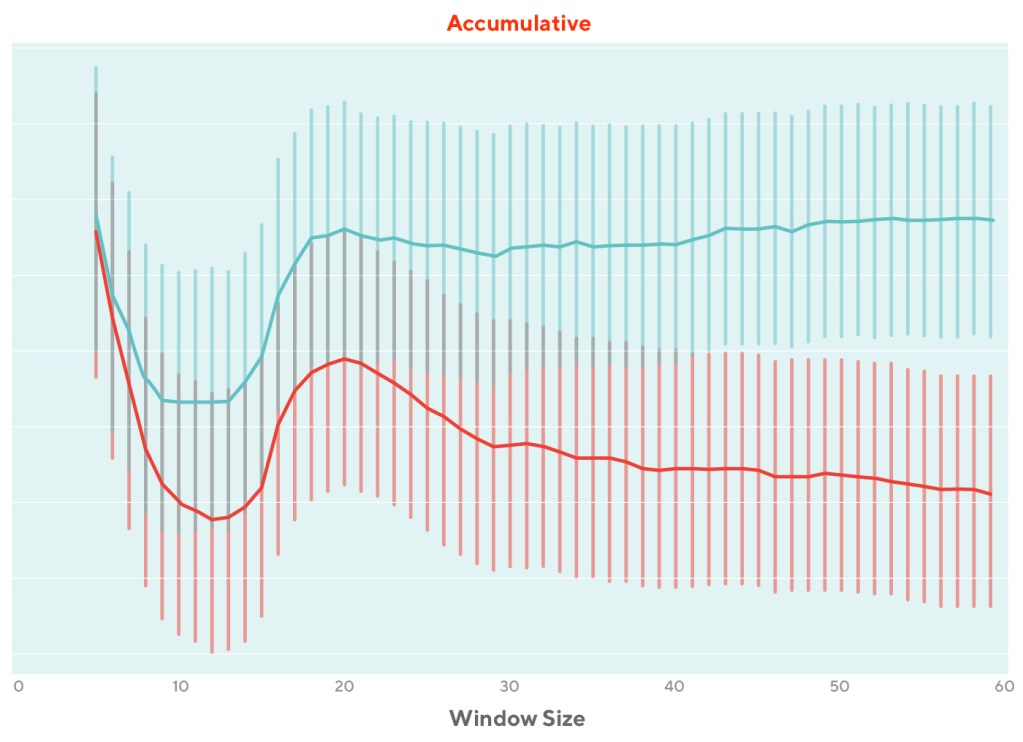
There are two parameters in the switchback experiment design, region size and window size, both of which impact the bias and power of the experiment.
The selection of window size of switchback is critical to determining the bias and power. If the window size is too small, there could be strong spillover effects between control and treatment units that are adjacent. On the other extreme, if the window size that’s selected is too wide, we will avoid the bias caused by spillover but have low power or sensitivity due to a smaller number of units that are getting the treatment. We have chosen the window sizes by conducting meta-experiments to understand the impact of window size on the experiment sensitivity and the bias of experiment results.
It is a similar case for the selection of region size. A larger region prevents the spillover between geography-adjacent control and treatment and hence has a smaller bias, however, with smaller power because of the smaller amount of units. An extreme case of the smallest region is using each individual store as a region. We conducted meta-experiments to validate that store-level region size will lead to inaccurate measurements. In some rare cases, if we want to use switchback to understand the impact of changing settings for a limited number of stores, we use store switchback. Because region switchback experiments are extremely insensitive and we believe the network effect is relatively small.
Our meta experiments help us understand the impact of using different window sizes and region sizes and pick the size that gets a good trade-off between experiment trustworthiness and velocity.
Controlling variance reduction
The sensitivity or power of a controlled experiment refers to its ability to detect differences in business metrics due to product changes. The Assignment team is the pioneer in conducting experimentation at DoorDash, where we tested and simulated a wide variety of methods to increase power, including simple covariates, stratification, post-stratification, and CUPAC.
In switchback experiments today, we mainly rely on one of the most effective and convenient variance reduction methods, CUPAC, which extends the idea for CUPED and is typically applied in consumer experiments. The idea of CUPAC is to leverage machine learning to construct the covariate that have a high correlation with the metric.
The CUPAC method dramatically improves the sensitivity of our experiments and thus improves our experiment velocity.
Capturing interactions between experiments
Given that at any given time, we have multiple experiments running simultaneously in the same region, those experiments may interact with each other to make the experiment results less trustworthy. Our two-zone system mitigates the issue by only allowing up to three experiments in zone 2 at a time. To mitigate the risk of shipping experiments with inaccurate measurements, we set up a playbook for interactions between zone 2 experiments.
First, we use advanced statistical methods to measure the interaction effect between each pair of experiments. The interaction effect gives us guidance on whether the two experiments augment each other’s impact, decrease each other’s impact, or have independent effects. In our playbook, we clearly define the experiment shipping criteria and rules based on the statistical inference on the experiment interaction. Our playbook for interaction is essential for us to run simultaneous experiments in parallel without worrying about the trustworthiness of experiment results.
Building an automated experimentation platform
DoorDash’s experimentation platform, Curie, automates as much of the experimentation process as possible. After the experiment is implemented and deployed, we need to turn on the experiment, monitor the experiment, and set up experiment analysis in Curie. As our experiment volume grows, it is critical to automate and streamline our experiment setup and analytics processes for any task that generalizes across experiments. Our team has been working closely with the experimentation platform team to minimize the incremental costs of creating and analyzing new experiments.
Creating the experimentation setup infrastructure
DoorDash’s experiment platform team has provided us with tools to build customizable experimentation infrastructure..
- We built an assignment-specific bucketing system to make it easier to run switchback experiments using our two-zone process.
- Real-time logging infrastructure allows us to query experiment buckets and other data in real-time. This is critical for monitoring and debugging our experiments.
- Most experiment settings can be performed with simple configuration changes, without code deployment. This makes it easy to enable, disable, ramp up, and ramp down any experiments.
Optimizing experimentation analysis infrastructure
The experimentation platform team built an in-house analytics portal to automate the analysis of experiments with simple user inputs. The tools have integrated state-of-the-art methodologies we have found useful to make the analysis scalable and scientific. Because of this infrastructure, experiment owners have easy access to trustworthy experiment results at any time without relying on analytics partners. It takes less than 5 minutes to add an experiment to Curie, and once added, the experiment metrics and p-values are calculated each day that the experiment is live.
Our analytics team has standardized and refined our metric calculations. Each experiment run by our team uses a standardized set of 100+ goal, guardrail, and diagnostic metrics. Our analytics and engineering teams built a custom experiment result dashboard so that the 30+ assignment experiment run per week can be accessed easily from one place to check daily metric movement. This has been essential for our weekly experiment review process where we make ship and iteration decisions for all assignment experiments in less than 45 minutes.
Conclusion
In a data-driven world being able to run massive numbers of experiments with scientific rigor and accuracy is key to unlocking fast development velocity. At DoorDash we were able to achieve this through the four pillars of our platform: a fail-forward culture, a scalable experiment process, rigorous statistical methods, and automation of our experimentation platform. While many of these actions address the Assignment team’s specific needs they can be utilized by many teams who suffer from similar challenges we worked to overcome.
Acknowledgments
Thanks to all members of the cross-functional Assignment team for the support to build the framework and develop the culture over the years. Thanks to Caixia Huang, Richard Hwang, Longsheng Sun, Jared Bauman, Carla Sneider, Arun Kumar Balasubramani, Yihan Tan, Alex Weinstein, Chi Zhang, Darby Schumacher, and Colin Schoppert for their contributions!
Special thanks to Professor Navdeep S. Sahni for providing guidance and counseling on the development of the framework and experimentation science at DoorDash.
Also thanks to Colin Schoppert and Darby Schumacher for their advice and help in organizing, refining, and editing the blogpost.
About the authors
Sifeng Lin works as an operations research scientist on Doordash’s engineering assignment team. He leads the design and maintenance of the experimentation infrastructure in the assignment team. He also works with the experimentation platform team to develop and improve the experiment analysis methodology in the assignment team.
Yixin Tang is a software engineer on DoorDash’s Experimentation Platform team. He is responsible for developing and maintaining the platform. He also leads the methodology working group in collaboration with Professor Sahni.


