
DoorDash offers an immersive internship experience where all our interns fully integrate with Engineering teams in order to get real industry experience that is not taught in the classroom. This is the first in a series of survey posts that will showcase some of our summer of 2022 intern’s projects. You can read about each project below.
Contents:
- DoorEye – Monitor ML Model Insights and Production Variance at Scale- By Wenfei Tang
- Building a Promo Code DevOps Tool for a Better Understanding of Campaigns- By Jayeon Koo
- Extending Kubernetes Horizontal Pod Autoscaler- By Jianna Liu
- Building New Internal Tooling Infrastructure to Improve the DoorDash Customer Support Experience- By Michael Yu
- Building Extensible Notification Banners Across Pages- By Xiaochuan Xu
DoorEye – Monitor ML Model Insights and Production Variance at Scale
By Wenfei Tang
We are building DoorEye to help our users from the Data Science and Machine Learning Team (DSML Team) monitor ML models in production and enhance ML model observability at DoorDash.
Why monitor models?
Model monitoring is crucial in the lifecycle of an ML project because after a model is deployed to production we want to make sure it’s performing as expected. ML models may suffer from model drifting or production variance after being put into production. Model monitoring, the process of supervising the quality of these ML models, can help us detect these problems and provide model evaluation in the long term. We can also plan model retraining accordingly based on the feedback from monitoring.
Problems with the legacy monitoring approach
Previously, our users from the Data Science and Machine Learning Team (DSML Team) monitored their model’s performance using an unscalable and manual approach. This approach was challenging for a few reasons:
- It was inefficient and did not scale well enough to meet our needs. Our users regularly need to manually run monitoring scripts to observe the performance of their models in production and have to set up a separate script for every model.
- Traceability was a challenge. We could not connect the created model metrics back to the metric source.
- Performance history was not provided. The model metrics and the labeled datasets are not stored. This prevents our users from analyzing historical model performance data. It is also difficult to run these scripts on a regular cadence and are only fit to run one off performance evaluation.
Our solution - model monitoring framework with declarative interfaces
We would like to support our users from the DSML Team by building DoorEye, a model monitoring framework which allows our users to monitor model insights and production variance at scale. DoorEye supports auto-triggered offline model evaluation, visualization of computed model statistics using our common metrics UI, automated labeled datasets and performance metrics storage in the Data Lake, historical data retrieval from the Data Lake, and threshold-based alerting for model drift detection. We are building DoorEye so that it can become a one-stop shop for product model insights for our users.
Key results and impact of DoorEye
After building and launching DoorEye, we were able to improve the quality and productivity of the model monitoring process for our internal users.
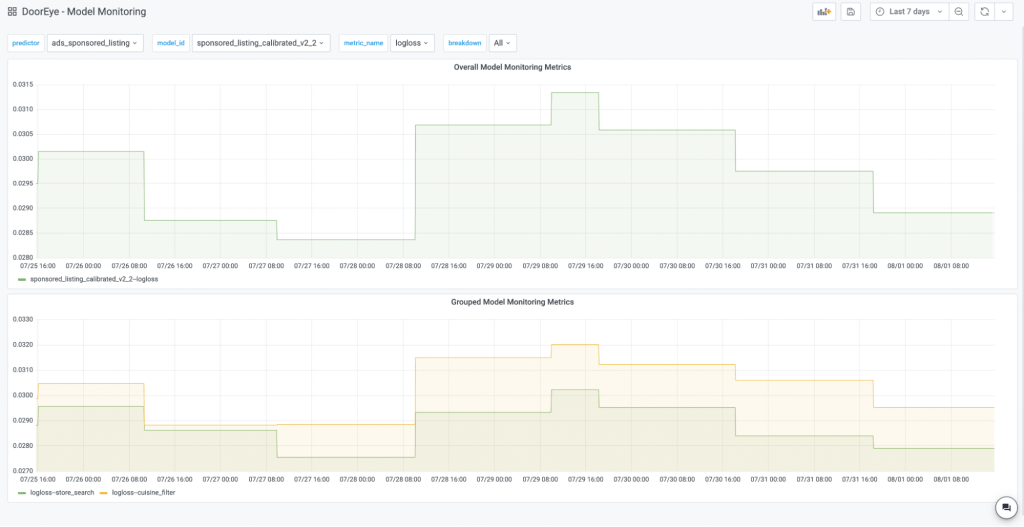
Our users now only need to submit a single configuration file to a centralized repository instead of creating a separate monitoring script for every model. DoorEye automatically triggers the job based on the schedule that users provide (see Figure 1) and completes the rest of the workflow for model monitoring. Users will then have direct access to dashboards with customized model statistics and data slicing (see Figure 2), and can retrieve data from Data Lake (AWS S3). DoorEye also makes model monitoring more cost-efficient because we can quickly detect failed jobs for our users with a centralized repository and avoid wasting computational resources. So far, the feedback from the team has been positive and appreciative of how much easier it is to monitor models in production.

Overall, DoorEye completes the step of deployment and monitoring in the lifecycle of an ML project. It addresses the velocity of creating new metrics for models by automating and standardizing the offline model evaluation process, and allows our customers to monitor model insights and production variance at scale.
Building a Promo Code DevOps Tool for a Better Understanding of Campaigns
By Jayeon Koo
With initiatives like Summer of DashPass growing larger each year, the Promotion engineering team regularly has to step in when promotion codes aren’t working. While promotion code errors seem simple, often the only feedback is that there is an error when consumers try to use a code at checkout. Therefore, we needed to build a deployment automation tool that would help debug broken promotion codes by collecting promotion validation events and allowing engineers to query that data with flexible queries. In this blurb, we will discuss the technical challenge in more detail and explain how we build the tool to address it.
Reasons that promotion codes may not work for an order
There are a lot of different conditions that we need to check before allowing a customer to use a promotion code; if a promotion code is authenticated haphazardly, this can easily lead to an influx of fraudulent orders. When we try to debug issues related to promotion codes, engineers and consumers alike will receive only an error message without more specification of what led to the error message. The error message would be something like “Something went wrong with the promotion, please try again later”. The same error message can have a number of different causes. So although promotion codes may fail for different reasons, they will often show the same generic message to the clients, and even to developers. Understanding the issue involves a long process of identifying the campaign in our database, gathering information about the experience from the customer or engineer that first spotted the bug, attempting to reproduce the error from an employee account, and checking logs in the terabytes of logs we collect everyday. This is a long debugging process that we would like to automate if possible so that creating and maintaining promotions is easier.
Building the DevOps tool to debug promotion code issues
To remove the painful debugging process involved in fixing a broken promotion code, the Promotion engineering team decided to create an internal tool to act as a one-stop solution to gather all relevant information about a promotion validation event automatically. Instead of manually reproducing the error to see where it could have possibly gone wrong, this tool will have enough information to directly give insight about what happened with the order. Figure 1 outlines the high-level overview of this project’s structure as two subsystems of write path and read path, or collecting data and analyzing the data. This classification helps to break down the project in the order of implementation and the sequence of information paths. Below we will explain the process of building this tool using this classification.

Write path: gathering the right information
The first step of this tool is to make sure that the information in question is logged accurately and thoroughly in the database. To debug a failing promotion code, useful information includes the promotion code, the consumer’s unique ID, items inside the cart at the point of promotion usage, timestamp, and the error messages for each attempt. All the data logged from promotion codes were saved into a separate database table for faster data querying. This information can be then analyzed and queried via the read path implementation of this DevOps tool.
Read path: querying the desired information
Now that we have collected the data in a separate table, we need a tool to query that information for easier access and better user experience. Using BloomRPC, which is a graphical UI for gRPC, we set up an endpoint to query the newly created database. The query object includes several fields such as the promotion code, store ID, and start/end time to allow flexible querying practices, as shown in Figure 2. Of course the database remains available for the developers to use the information to the fullest extent.

How the DevOps tool has sped up debugging
As soon as the table and endpoint were ready, the Promotion engineers started using them during their oncall rotations. One particularly useful scenario was when a promotion was designed with a specific item, such as get X off when purchasing Y item. An operator helped to set up the promotion for a merchant who wanted to sell more canned drinks from their store, but the promotion code was not working as expected. The root cause was that the item inventory list in DoorDash is not consistent. For example, the same exact soda at a grocery store and a convenience store may have different item ids. In this case, the promotion specifically called for a soda with item ID A, when the merchant had a soda with item ID B listed on their store. This discrepancy in the item ID was quickly identified when a developer placed an order using the promotion code in question with the can of soda in the cart.
This has been a powerful development for the team's workflow, and has potential for great impact beyond the end of the internship.
Extending Kubernetes Horizontal Pod Autoscaler
By Jianna Liu
DoorDash uses Kubernetes to run microservice workloads. Most microservices in our system run on Kubernetes and are managed by Deployments and Argo Rollouts. Microservices are either given a set number of pods throughout their lifetime or have a dynamic number dependent on CPU utilization when Horizontal Pod Autoscaling (HPA) is enabled. What does that mean exactly and what is the problem we are trying to solve?
Currently, to allocate a dynamic number of pods, microservices utilize HPA to determine how many pods they are given. HPA will determine this number of pods by measuring the CPU and/or memory utilization of this microservice. There are use cases that are not supported by autoscaling using CPU. For example, many workloads utilize load shedding. Load shedding means these workloads will reject excess traffic once a workload comes close to becoming overloaded. Thus, these load shedding workloads will not see too many CPU spikes, meaning that for them CPU will not be an accurate metric to autoscale by.
By not scaling accurately, we waste resources and have more operations burdens. In June 2022, a lot of DoorDash’s cloud infrastructure costs originated from Kubernetes EC2 nodes. By introducing autoscaling of external metrics, we estimate we can prevent resource waste for each microservice.
We integrated KEDA , an open source framework, into our system to help us autoscale on a variety of events through user-defined events. The impact we seek to have is reduced costs for the company due to less wasted resources and less manual intervention from developers.
Deploy a ScaledObject
Let’s start by running a quick experiment. Before we start, please make sure there is one Kubernetes cluster available and KEDA is installed in the cluster.
We will create the following ScaledObject resource to autoscale the example php workload taken from the Kubernetes HPA walkthrough.
scaledobject.yaml
apiVersion: keda.sh/v1alpha1
kind: ScaledObject
metadata:
  name: cron-scaledobject
  namespace: default
  labels:
    deploymentName: php-apache
spec:
  maxReplicaCount: 12
  minReplicaCount: 1
  scaleTargetRef:
    name: php-apache
  triggers:
    - type: cron
      metadata:
         timezone: America/Los_Angeles
         start: 30 * * * *
         end: 45 * * * *
         desiredReplicas: "10"
This yaml file will create a ScaledObject that auto scales the php-apache deployment (specified under .metadata.labels.deploymentName). We are using a Cron scaler.
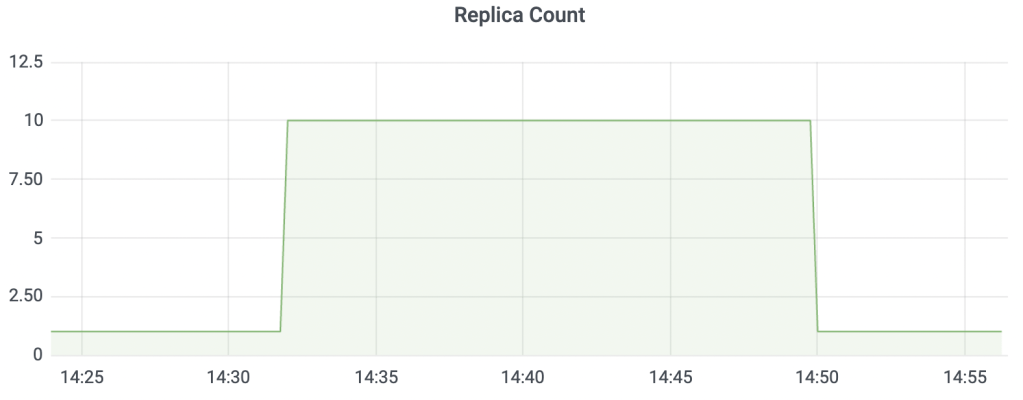
At around the 30th mark, the deployment count should increase to 10 and at around the 45th mark, the deployment count should decrease to one as shown in Figure 1.
How does KEDA work?
Its architecture is shown below. Let’s dive a little deeper.

- First, a user will create a ScaledObject, as shown in Figure 2. The KEDA controller will watch for any new ScaledObjects.
- If the use case is to scale the pod from 0 to 1 or from 1 to 0, the KEDA controller will manage the deployment replicas directly. If the use case is to scale the pod from 1 to n or from n to 1, the KEDA controller will internally create a Kubernetes HPA to manage the deployment.
- HPA will read metrics from the Kubernetes API server which then forwards the request to the KEDA metric server.
- The KEDA metric server contains the values of all of the event metrics, subject to which scaler we use. In the above diagram, the metric server is using a prometheus scaler.
We will support the CPU scaler, the Cron scaler, and the Prometheus scaler for the first iteration. The CPU scaler will allow KEDA to have feature parity with current HPA autoscaling. The Cron scaler autoscales to a predefined number of replicas in a predefined time period. This process provides proactive autoscaling, allowing microservices to anticipate heavy load and define allocation of pods for predicted periods of peak traffic. The Prometheus scaler autoscales based on external metrics from Chronosphere. This provides reactive autoscaling. We expect that proactive autoscaling using the Cron scaler can cover most use cases. However, when proactive autoscaling does not anticipate traffic correctly, reactive autoscaling will be able to help.
So how can developers use KEDA?
Internally, we use helm charts to deploy services. We will introduce a new field autoscaling in the helm chart, where there are both predefined sub parameters and flexibility for users to define their own parameters.
service:
 autoscaling:
   minReplicaCount: 10
   maxReplicaCount: 20
   enable: true
   metrics:
   - cpu:
       threshold: # 50
       type: # ‘Utilization/AverageValue’
   - cron:
       start: # 30 * * * *
       end: # 45 * * * *
       desired: # “10”
   - qps:
       threshold: # 50
       service: # payment-service
       app: # web
   - external:
     - prometheus:
         threshold: # “200”
         query: # ‘’
         metricName: # unique_metric_name
One issue we foresee is that people could input the wrong query on accident, and this will result in inaccurate autoscaling. Thus, we want to offer the ability to have pre-defined metrics such as qps, as well as give users the flexibility to define. We are not sure what exact pre-defined queries we want to offer just yet, but after talking to developers, we hope to find a pattern in a common query. We anticipate common queries to be QPS and queue size for Kafka workers.
What are some important metrics?
Important metrics we want to keep track of to guardrail our migration include the following:
- keda_metrics_adapter_scaler_error_totals - The total number of errors encountered for all scalers
- keda_metrics_adapter_scaled_object_errors - The number of errors that have occurred for each scaled object
- keda_metrics_adapter_scaler_errors - The number of errors that have occurred for each scaler
- keda_metrics_adapter_scaler_metrics_value - The current value for each scaler’s metric that would be used by the HPA in computing the target average.
- go_threads - created by KEDA controller, number of threads created
- go_gc_duration_seconds - created by KEDA controller, pause duration of garbage collection cycles
- go_goroutines - created by KEDA controller, number of goroutines that currently exist
- controller_runtime_reconcile_errors_total - created by KEDA controller, total number of reconciliations per controller
- workqueue_adds_total{name=”horizontalpodautoscaler”} - created by kubernetes controller manager, total number of adds handled by workqueue:
- workqueue_duration_seconds_bucket{name=”horizontalpodautoscaler”} - created by kubernetes controller manager, how long processing an item from workqueue
- workqueue_depth - created by kubernetes controller manager, current depth of workqueue
- apiserver_request_terminations_total - created by kubernetes apiserver, number of requests which apiserver terminated in self-defense
What does success look like?
Success looks like the complete migration of microservices currently using the old interface to the new interface and onboard most services to autoscaling.
We hope that our impact involves reducing costs for the company due to less wasted resources and less manual intervention from developers.
Building New Internal Tooling Infrastructure to Improve the DoorDash Customer Support Experience
By Michael Yu
Like many companies, DoorDash uses a variety of methods to authenticate an account. To improve the customer experience we want to make this process as painless as possible. Common authentication methods include two-factor authentication, push notifications, and SMS messages.
Emails are commonly used for multi-factor authentication as well, but sometimes users are unable to receive authentication emails. Not getting emails prevents users from performing important actions such as logging in, password resets, or creating a new account. In this blurb, we will discuss the impact this has on the user experience and how we built internal tooling to resolve the issue.
Pain points with customer support
A user that is unable to receive two factor authentication emails will naturally reach out to DoorDash’s support team. However, the support team doesn’t have the ability to change email subscription preferences. Tickets that cannot be handled by support get forwarded on to on-call engineers, which can take some time to resolve and take up valuable engineering time. To reduce the daily workload for the Core Platform on-call team, we created new tooling to help resolve this common issue.
Creation of new internal tooling
As a solution to this email verification problem, we have built a new internal tool to extend permissions to the support team to view and update email subscriptions without the assistance of the engineering team. This tool will alleviate the problems above as it will increase support team coverage of these types of tickets, reduce response time, and reduce the on-call workload of the Core Platform team. Such a tool, which is depicted in Figure 1, should allow the user to get email subscription preferences, modify those subscription preferences, check permissions of the user, and be easy to navigate and utilize.

Architectural deep dive
To build this email permissions tooling, we had to build a new full stack application.
On the server side, we created a new gRPC microservice to hold the logic of email preference management and user authorization. This new service will serve as the home of all future notification preference management, providing the initial infrastructure to facilitate development of additional preference management tools for other notification types beyond emails, which is anticipated.
On the client side, we chose the service to be located with other internal tools on Admin Gateway, an Apollo GraphQL based backend for frontend (BFF) middle layer. DoorDash uses this layer to isolate backend development from the front-end, as well as aggregate, process, and forward requests from the client to internal services. Here on Admin Gateway, we added a new responsive tooling page using React that integrates with the BFF middle layer to communicate with the server-side microservice.
These design details can be seen in Figure 2 below.

Impact of our solution
In total, the email subscription support tickets account for ~60% of all tickets received in July 2022, making up a majority of tickets for the Core Platform team. The creation of this tool will significantly reduce the number of tickets that constantly clutter up the Core Platform channel, increasing on-call productivity by eliminating these numerous daily interrupts.
Additionally, these tickets are not only a nuisance for the engineering team, but for the support team and the customer as well. For the customer’s experience, the issue may take a few days to resolve, depending on when the engineering on-call can pick up the ticket. For the operator’s experience, the support team often has to reach out to multiple different teams before they find a solution to those tickets. By eliminating the engineering team from the process, we can increase the customer turnaround time from a few days to the instant that the customer reaches out to the support team, improving both the customer experience and the operator experience.
Building Extensible Notification Banners Across Pages
By Xiaochuan Xu
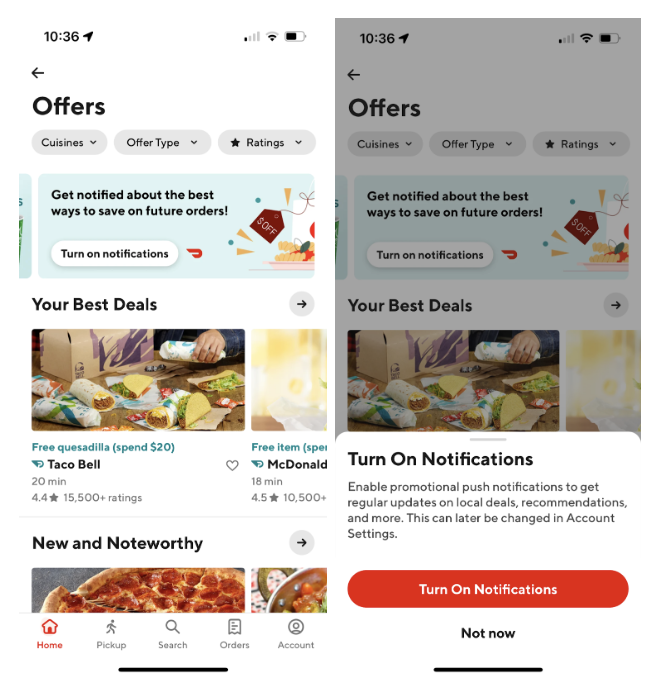
The notification feature is one of the most important features on the DoorDash app. It not only helps users track their latest order status, but it also notifies consumers about the best deals in their area. However, millions of users haven’t subscribed to marketing push notifications, which gives them less opportunity to enjoy the benefits that DoorDash offers.
In order to build a notification banner, as shown in Figure 1, we needed a way to add it extensively so that it could easily be added to every page in a short time frame. While building banners is relatively easy, making them extensible is challenging because on one hand, these banners are similar since all of them share the same users’ notification preferences, and on the other hand, each of them needs to have a standalone experiment and a feature flag, so that the analytics can monitor the effectiveness of each banner. Given these challenges we built a backend tool that would allow us to build extensible banners more easily. Using this new solution, we can easily ramp up the notification banners on other pages, bringing more marketing push subscribers more quickly in the future.
Technical challenges in adding a new notification banner
Adding a new notification banner in a particular page may not be a hard job, but creating an extensible way to add a new banner on different pages is difficult. For one thing, we would like to avoid repeated calls to obtain the users’ notification preferences, and reuse the information for all banners. This can greatly reduce the burden of downstream service that provides users’ preferences. Additionally, we would like to exert fine-grained control on each banner for experiment settings and feature flags. The seemingly conflicting condition adds additional difficulty in implementation. If we forcefully put all these requirements together, the resulting codes will become less maintainable, less readable, and more lengthy. Unfortunately, the previous implementation took the most obvious way, combining these requirements coupled together. What’s worse, the situation will deteriorate with more notification banners being added on different pages.
Building an extensible notification banner solution
To build an extensible notification banner solution, we had to pursue the following steps:
- Review the legacy solution, specifically we needed to figure out the existing endpoint, which will filter and return necessary banners to a consumer
- Ensure that users’ preference information is reused across different banners
- Design our own solution that would fit into the architecture of the existing endpoint since it can provide us with a fine-grained control on individual banners
Reviewing the legacy solution
To build an extensible notification banner, the first course of action was to take one step back and revisit how the endpoint (getBannersV2) of returning those banners works, as depicted in Figure 2. There exists a filtering pipeline in getBannersV2 that will firstly fetch all relevant campaigns (note we will use “banners” and “campaigns” interchangeably for simplicity) for a consumer. Then the EligibilityMetaData will be generated, which is the metadata that stores all the information necessary to filter out invalid campaigns later on. Next, the filter will check a campaign based on a series of criteria, comparing each of them with the EligibilityMetaData, so ineligible campaigns will be filtered out and only valid banners will be returned to the client side for a particular request.
The original filtering pipeline is elegant and efficient since it decouples the process of fetching users’ information (EligibilityMetadata) with the step of actually checking the information. However, the previous implementation of the notification banners doesn’t honor this pipeline. Instead, it added an ad-hoc logic to fetch users’ notification preferences, and then check against it to filter the banners related to notification (Figure 2). This solution is not able to solve the technical challenges mentioned above, and becomes worse every time a new banner is added.

Ensuring user notification preference data is reusable across banners
After reviewing the architecture of getBannersV2(), we realized that the essence of the solution is to reuse the original filtering pipeline, which means we should add our own logic in the right place within the pipeline.
For users’ notification preference data, we can fetch once and reuse it multiple times for different banners. Therefore, during the generation stage of EligibilityMetadata, we should make an external gRPC call to another service at DoorDash, to fetch users’ notification preference data and store it into EligibilityMetadata for later usage.
To actually use EligibilityMetadata, we should ensure this campaign (banner) has a new corresponding user criterion regarding users’ notification preferences, as shown in Figure 3 . To achieve that, we need to build a new userCriterion through the protobuf, and assign this criterion to the notification banner, which indicates that we would like this banner to be checked against the notification preferences of a particular user. The filtering pipeline will automatically execute the whole process for us.

Providing fine-grained control on individual banners
One of the benefits of embracing the pipeline is that it facilitates us to manage the experiments of individual banners with a user interface, the campaign manager. With that, we don’t need additional codes for setting the experiments for a banner. Instead, all we need to do is to configure the experiment for a particular banner in the campaign manager. This helps us add a new banner more quickly, since new banners no longer require any code changes regarding the experiments.
Benefits of the new implementation
With the new implementation of the notification banner, it can be easily and quickly extended to other pages. Compared to the initial implementation, the logic for filtering the banners based on users’ notification preferences is the same and can be reused across notification banners on different pages. Moreover, we will not need to program experiments in the codes. Instead, by embracing the pipeline, the campaign-level experiments are naturally supported. Compared to using runtime to programmatically change the experiment settings, we can now configure the experiment through DoorDash’s in-house experiment platform - Dynamic values. Overall, the refactoring can reduce the roll-out time of the notification banner from a few hours to just a few minutes, greatly saving the engineer’s efforts.
Impact
This project has brought positive engineering influence, but perhaps even more importantly, the project is generating positive business impact as well. After refactoring, the Offer Hub page notification banner has been ramped up to all iOS users, which is millions of targeted users. We expect there will be an annualized increase of hundreds of thousands of marketing push subscribers due to this feature.


