
DoorDash offers our summer interns the opportunity to fully integrate with Engineering teams to get the kind of real industry experience that is not taught in the classroom. This is the third blog post in a series of articles showcasing our 2022 summer intern projects. If you missed the first or second article the links are here and here. You can read about each project below.
Contents:
- Enabling DoorDash’s Financial Data to be Queryable by Storing Data in Parquet Files - by Rini Vasan
- Accelerating Developer Productivity by Building a Delivery Debugger - by Peyton Chen
- Optimizing Push Notification Prompt Initiatives - by William Louis
- Sending Mx Banking Notifications to Prevent Deactivation - by Amrita Rajan
Enabling DoorDash’s Financial Data to be Queryable by Storing Data in Parquet Files
By Rini Vasan
As DoorDash’s business grows exponentially we need to accurately record the changes that affect financials, but the challenge is that these changes are distributed throughout different domains and across various flows. For example, an order submission will touch a customer, a Dasher (our name for delivery drivers), a merchant, a pay-in, and a payout. Today these changes are entered as single entry systems that are prone to errors and difficult to reconcile. There are various challenges with respect to data mutability, long intervals between changes, and data fixes. The Revenue Platform (RP) team is attempting to mitigate these issues by providing mechanisms for recording financial transactions in a compliant and auditable way that is amenable to accounting and reporting.
There are multiple microservices (Aggregator, Reprocessor, Archiver, Workflow) for the revenue platform that work in tandem to achieve our goal, but this post will focus on the work of the Archiver service. The primary purpose of Archiver is to pick up events containing financial transaction data sent by different upstream teams and store this data in a data lake. This data is currently persisted for audit and to be used in case of correcting any accounting data.
Problems with the data stored in Archiver currently
Currently, in order to query and read the raw events, we use an application called Reprocessor, which picks up the event data stored by Archiver and sends them for reprocessing by the platform. Archiver is a flink application that listens to multiple different events on kafka topics. The event data is stored in AWS S3 in an encoded format in JSON files. After the workflow processes the data, we can query events from the cockroachDB database, which is used by DoorDash as a database solution, and the Snowflake data warehouse to see the final results of processing. After reprocessing, we are able to decode and read the event data stored by archiver for reprocessing.
However, when using a web based notebook for data analytics to parse the JSON files, the data is not decodable, meaning that the data cannot be queried. This non-decodable data makes it much harder for us to understand the data stored by the archiver. By only being able to read event data after workflow processing, other teams that use this data will need to wait for the Revenue Platform team to onboard events to the workflow as well as wait for it to show up on the cockroachDB database. This process causes delays when teams are building new or changed events because there is no easy way to verify the data in the new or updated events, which significantly slows down new feature launches and experimentation.
Making the data stored in Archiver queryable
Currently, Archiver stores the data with a lot of custom code that follows a specific lifecycle. First, the event is ingested and the data is read and aggregated into different attributes such as the ingestion time as well as other specifics about the Event itself. All of this data and the raw event data itself is encoded and stored in a class object. Next, the data is read and pushed into AWS S3 through S3’s APIs.
With the new changes to the archiver, instead of storing the data in an encoded JSON format, we stored the event data in parquet format with a defined schema per event type. The reason we chose to use parquet format instead of JSON is because parquet format is natively queryable by many different analytics tools like a web based Apache Spark notebooks with analytical functionality without any need for decoding. However, if we continued to use JSON then we would not be able to directly read or query without going through the entire lifecycle described above, which takes a lot of time.
In order to implement the changes described above, we read the event data that is coming in directly and aggregated it into a similar class object as described in the lifecycle above. We then used a connector from Flink called Streaming File Sink to convert the data into parquet format and push this data directly to S3 without needing any custom built code for the full lifecycle. Streaming File Sink takes in the output path which would be the S3 path to store the data and a parquet writer object. In S3, we stored the parquet files per event in a per hour folder.
With these new changes described above, specific details of an event can be written in parquet format, which is natively queryable through Spark notebooks without a need for decoding or using any Revenue Platform specific libraries. After event data is pushed to production, we can allow other teams to query the data directly with no wait time for the workflow application to process it.
Impact of the upgraded archiver
Now that we are able to query the data stored by the archiver, it helps engineers in alerting, monitoring, and debugging any issues that might arise from other applications involved in the complete lifecycle of the revenue platform. This leads to reducing developer overhead and development hours for many issues. We are now saving two days of developer efforts when getting details about new events from upstream. Previously, these two days would have been used to onboard the new events onto all revenue platform services. However, now we can just instantly verify the events and the wait is no longer required. Also, we are now able to open up the Spark notebooks query to other teams. Therefore, the impact of the upgraded archiver now allows other teams, even non-engineering teams such as the Accounting or Audit teams, to query the events and verify all changes themselves, which significantly increases the velocity of new feature launches.
Accelerating Developer Productivity by Building a Delivery Debugger
By Peyton Chen
One of the largest challenges of the logistics platform team is that we are the owner of numerous critical services with downstream dependencies relying on these services as sources of truth, especially those surrounding delivery information and delivery-to-Dasher assignment information. When deliveries do unfortunately go wrong, pulling information from these sources of truth is typically the first step of identifying root causes. However, outside of manual database queries across multiple distinct data sources, there is currently a lack of resources in debugging production issues – a pain point during outages. Here, we will describe how we built a new internal tool as part of our goal for operational excellence and quality.
Problems with current methods of gathering data for debugging
There are a few key reasons motivating the creation of this tool:
- We rely on our legacy codebase, that we are actively transitioning away from, to run database queries.
- Customer support tooling can be helpful and provide some information, but often abstracts from the core sources of truth and is not engineer-oriented.
- Running queries on our data warehouse is a possibility, however, this is not realtime.
- Production databases are sensitive and do not allow for joins, requiring workarounds as critical information is spread out among many different tables
- Manual queries are slow and require a lot of experience
- There are often simple data-gathering requests from other engineers to our team which takes time for us to respond, meaning greater mean time to resolution, and consumes unnecessary engineering resources.
Building the debugger
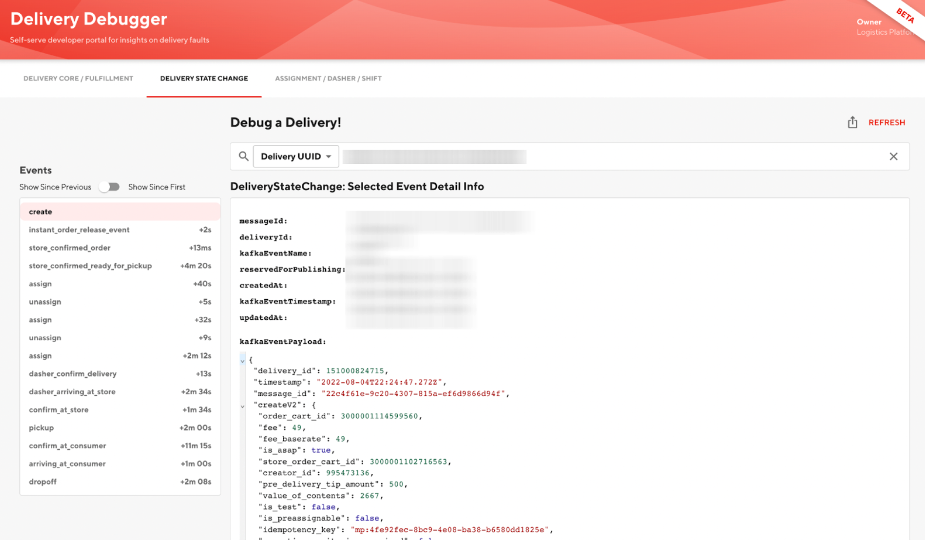
Our new debugger is a self-serve platform and insights dashboard for providing a cogent aggregation of data and highlighting data inconsistencies aiming to address all of the above concerns. It is hosted as a plugin on a DoorDash-adapted internal tooling website based off of Backstage by Spotify. The current version of the debugger displays logical groupings with like fields together offering a view into how a delivery is represented in the database as shown in Figure 1. The biggest feature is offering a display of each mutation on the delivery object as it travels from being created all the way through to being delivered or another terminal state as shown in Figure 2. The data is supplied from a gRPC endpoint that we created reading from a database that mirrors every time a kafka event is sent from the kafka topic that tracks all events a delivery encounters. Assignment history is offered as well with the associated Dasher information, shift information, and shift route as shown in Figure 3.


In addition to providing convenient views, we have plans to develop a robust set of constraints and a display for instances of constraint violations, indicating potential bugs in representing a delivery. We also intend to have a dashboard that suggests deliveries to look at - such as those that fail the aforementioned constraint rules or the top 100 late orders in the last 30 days, to name two examples.
Impact
We are already seeing adoption of the tool, with developer productivity improvement estimated to be in the 5-10% region when troubleshooting. Ultimately, the biggest result we have begun to achieve is setting an example for other teams on the importance and value of internal tooling that can help developers identify patterns quickly and autonomously with problematic deliveries. Multiple teams have already expressed commitment for continuing to integrate their services with the delivery debugger or create similar tools. We anticipate to have paved the way for better tools to debug production issues, allowing us to continue to grow and be the world’s best last-mile logistics provider.
Subscribe for weekly updates
Optimizing Push Notification Prompt Initiatives
By William Louis
DoorDash has many promotions, offers, and other deals that we offer our pool of consumers. We advertise to engage our users as much as possible on our platform. One method of notifying them of these benefits is through emails. However, users are more likely to check their application notifications and learn more from there. Prompting users to turn on their notifications allows us to reach out to them regarding these benefits more easily.
Problem with our unsubscribed user group
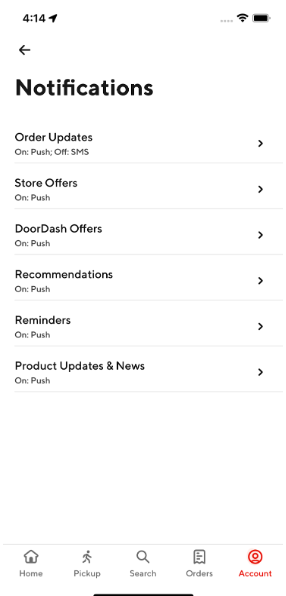
The notifications team under the DoorDash growth organization conducted analysis and found that millions of users had an invalid or null notification subscription status. The team was able to re-subscribe 88% of these unsubscribed users to mobile application push notifications, leaving a large number of users unsubscribed (the remaining 12%). We want as many users as possible to be subscribed since unsubscribed users do not receive the marketing pushes that would keep them engaged on our platform and with our services. Within the mobile application, there exists a notification preference center (see Figure 1) that can help these users subscribe, unsubscribe, and re-subscribe to DoorDash notifications. However, this feature requires more manual work on the user’s part and as being customer-obsessed is one of our core principles, we want to make the subscription process as automated as possible.
The push prompt initiative
The notifications team wanted to create a strategy that allowed users to easily subscribe to DoorDash notifications. We wanted users to have an automated method of getting notified of all the benefits that we offered to them in order for them to be engaged on our platform. This strategy involved advocating the benefit of the subscription while providing easy access to these subscription workflows in a single click which was more convenient than using the app’s notifications center.

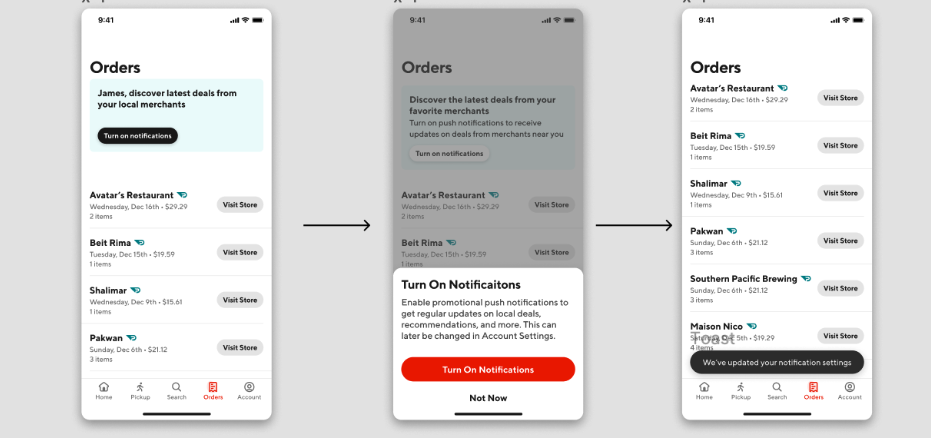
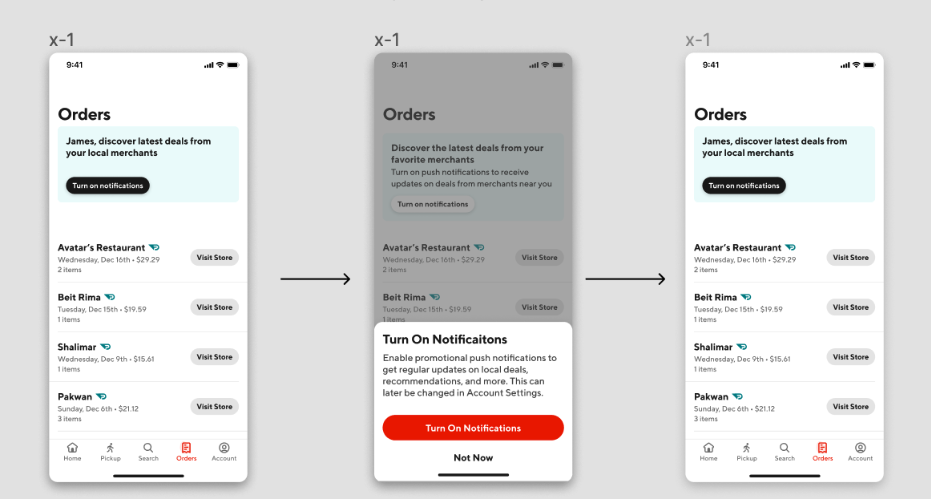
The push prompt initiative involved adding push prompt artifacts across key parts of the user journey. These key parts included the orders and the offers hub pages, and banners were added to these pages on the iOS app (see Figure 2). These two pages have a huge amount of daily impressions, so we decided that it would be a good approach to place these banners here to reach out to the millions of users who had not subscribed to notifications.
How we built push prompt features
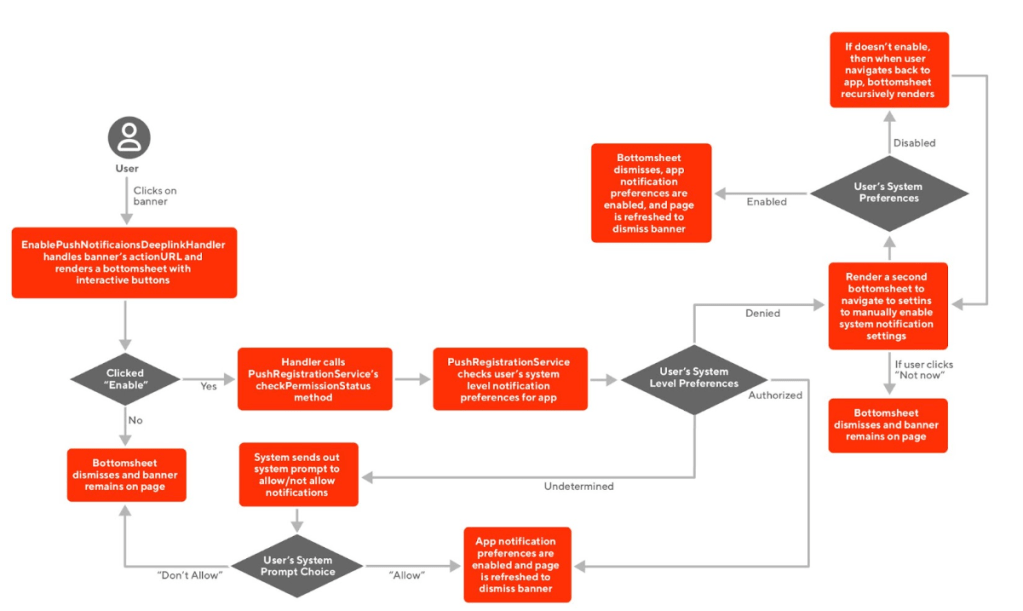
Upon the click of the banner, the workflow will trigger a bottomsheet to render (see Figure 3 and 4). In the bottomsheet, there are button prompts to either subscribe or dismiss the sheet. There are multiple workflows that can be executed through this bottomsheet.
How we implemented the push prompt feature
The engineering implementation of our push prompt feature in the iOS application involved the EnablePushNotificationsDeeplinkHandler, PushRegistrationService, and iOS system level APIs all working together (see Figure 5). The EnablePushNotificationsDeeplinkHandler handled the banner’s action URLs by rendering the bottomsheet. Along with presentation, the handler also handled the button clicks and would utilize PushRegistrationService to take care of flow determination. If any workflow required checking system level settings, then PushRegistrationService would interface with the system level settings API.
Results
Our analytics team was able to conduct analysis and predict that the notification banner placement in the Offers Hub page would contribute to a 15% uplift on the number of users that will opt into subscribing to App notifications upon visiting one of the targeted pages. We also did some analysis for the order page push prompt banner placement, and so far, our experiments read that there is a 27.5% uplift in push opt-in rates for customers visiting the page. Both of these features have been rolled out on the iOS application for A/B testing. Within 4 weeks, we hope to conclude that our push prompts’ uplifts on consumer metrics to be statistically significant.
Sending Mx Banking Notifications to Prevent Deactivation
By Amrita Rajan
One of the challenges to ensuring merchants have a smooth onboarding experience to DoorDash is collecting accurate banking information. If any banking information is added incorrectly, it can cause deactivation or general frustration. In this blurb, we will discuss how we mitigate this issue by building notifications around merchant banking information by using Kafka and Cadence.
Why we need to explicitly notify merchants
When merchants input their banking information during onboarding, the payment processor does not immediately verify the information in order to prevent delays. Upon later review, if the processor determines that a merchant has invalid information, the merchant’s payouts can become blocked. After a certain period, if these issues are not resolved, the merchant’s account will ultimately become deactivated.
Currently, the banking page in the merchant portal displays a banner alert if there are any errors or missing information. While helpful, this feature is not effective in resolving the issue because the merchant does not receive any alerts and would therefore need to manually check the portal in order to be aware that something is wrong. Merchants only receive an email after their account is deactivated, which can be too late to resolve the problem.
Ultimately, this lack of notifications can disrupt the merchant experience and should be rectified. If merchants are in an unverified state, the current banner alert approach delays them from becoming active on DoorDash and could potentially discourage them from joining altogether. By directly sending emails, it allows merchants to be proactive about fixing their information.
Obtaining the payment information from payment processor
In order to implement this feature, we would need to have information about a merchant’s payment and banking information in the onboarding service. The onboarding service is owned by the Merchant Selection and Onboarding Team. It houses operations pertaining to merchant onboarding.
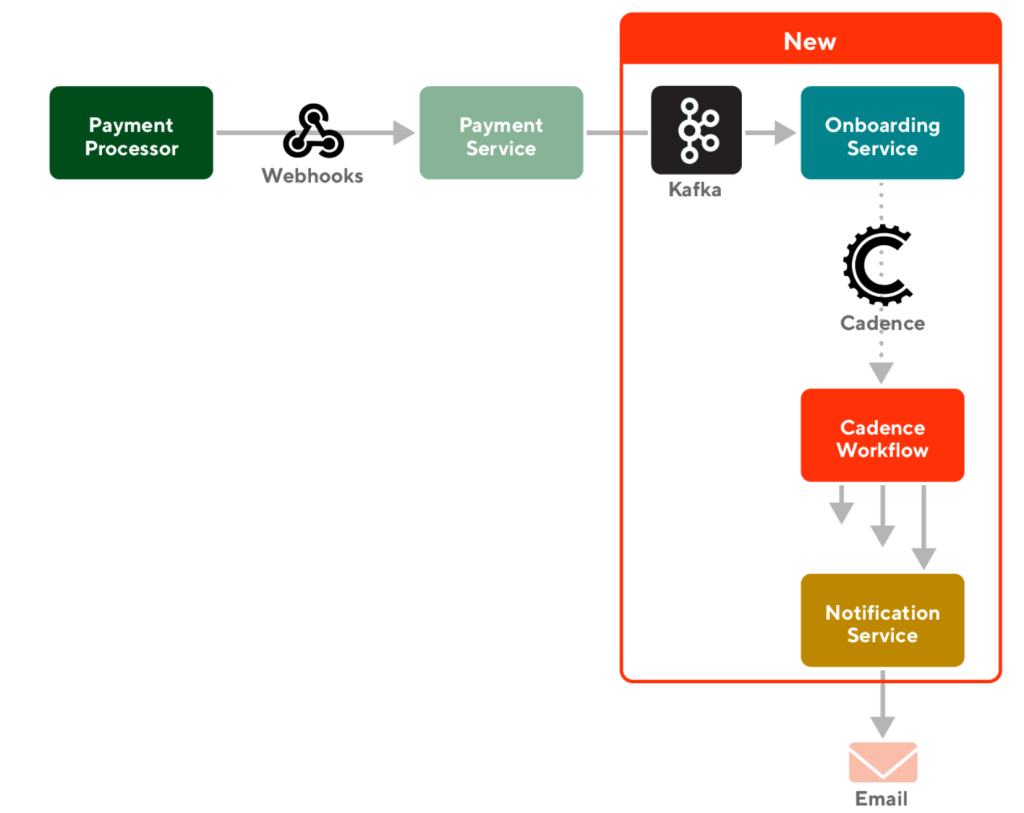
As depicted in Figure 1, the payment processor sends webhooks to the payment service. Webhooks are automated messages containing pertinent information that are sent when an event occurs. An event in this scenario would be if a merchant updates their banking page or any other financial activity.
We set up a Kafka integration in onboarding service. Kafka is a type of event streaming that enables us to process data in real time. Payment service produces a Kafka topic – or a type of event – that contains all of the necessary information about a merchant’s current verification status. Setting up a Kafka integration in onboarding service allows us to read information from payment service, thus, establishing a connection between the two services.
Setting up workflow to send emails
After receiving information from the payment service, the next stage is to actually send the emails in the onboarding service.

Each time we receive a Kafka event or information about a merchant’s financial information, we process it. We parse various fields in order to decipher whether or not a merchant is verified. If they are not verified, we send them recurring emails that remind them to check their portal and update their information. However, if they are verified, we stop the emails. In order to proactively send these emails, we use Cadence, a workflow that executes a sequence of activities.
Impact
After the email notification feature goes live, merchants who are at the risk of deactivation will receive reminder emails. Unlike the banner alert approach, this will resolve the invalid information sooner and more efficiently. The success of the project can be measured by the decline of merchants who become deactivated due to incorrect banking information.


 MarcoChirico


