
As e-commerce platforms grow, their web applications begin to slow and performance-boosting techniques are required to maintain their speed and functionality.
At DoorDash, we have faced similar problems as our web application has expanded, with users sometimes having to wait up to 10 seconds for the UI to load — potentially longer if the network is bad. We've been working to improve the web performance of our product to elevate the user experience. Here we share some of the challenges we’ve encountered and lessons that we have learned along the way. These five key actions can help any large platform enhance its performance metrics:
- Manage the JavaScript bundle size
- Defer rendering of the DOM elements outside the viewport
- Improve rendering time by reducing API bottleneck
- Delay loading render-blocking resources
- Apply the right cache policies
Manage the JavaScript bundle size
The performance of websites with large JavaScript bundles can be impeded because it takes longer for users to download the bundle to their devices and decompress, parse, and execute the bundle. Here are some things to keep in mind as part of managing bundle sizes.
How to detect performance issues related to bundle size
Tools like WebPageTest or Chrome’s Lighthouse dev tool can be used to audit a page and view a performance analysis report that includes identified issues and opportunities to improve them. As shown in Figure 1, opportunities such as “Reduce unused JavaScript,” “Avoid an excessive DOM size,” or “Reduce JavaScript execution time” indicate that the site’s bundle size needs to be reduced.

How to reduce bundle size
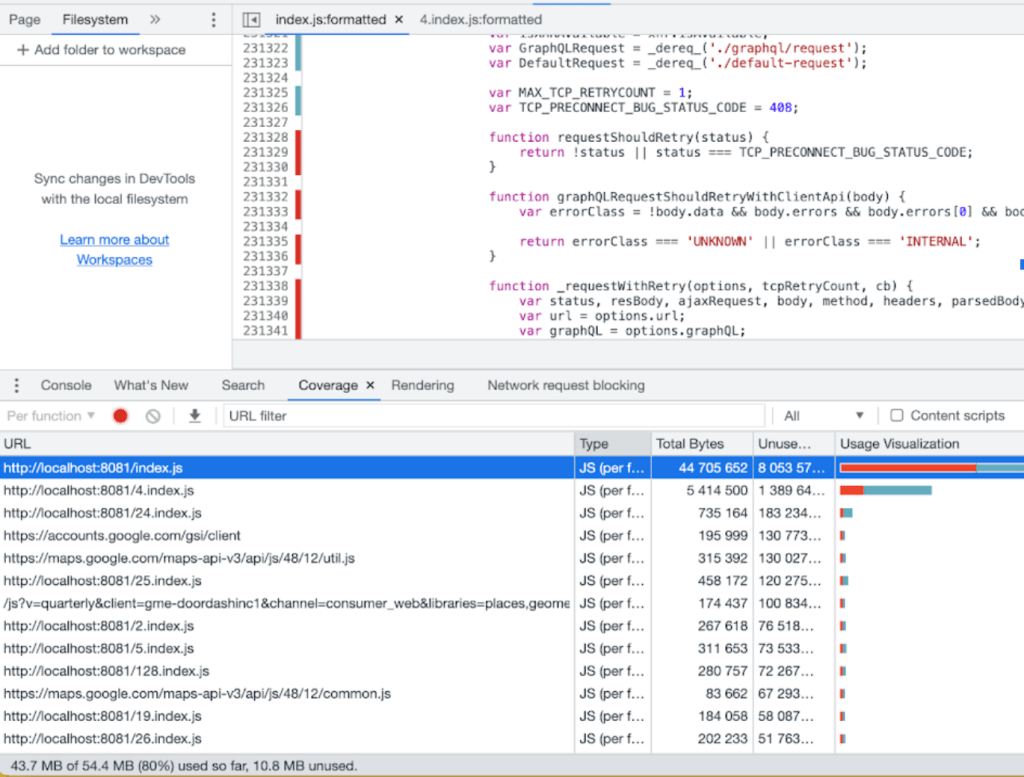
First, analyze what’s in the bundle using tools like webpack-bundle-analyzer to determine which component/module/library contributes the most to the final bundle. Alternatively, use Chrome’s Coverage dev tool, depicted in Figure 2, to identify the “unused” code of a bundle in the current page.
Following this analysis many techniques can be applied to reduce the bundle size, including:
- Tree shaking the unused code
- Splitting code and lazy loading chunks of code as needed for the page
- Splitting a big bundle into smaller chunks and making use of HTTP/2’s capability to load those chunks in parallel
These are well-known techniques that are easy to apply when the codebase is still small. But at DoorDash, the consumer website is already a massive codebase maintained by more than 60 engineers. Changes require coordination between teams and feature owners as well as enough manual/automated testing to ensure they don’t break high-traffic pages. Considering our time/resource restrictions, the techniques mentioned here didn’t suit our purposes, but we found other low-hanging fruit to reduce the bundle size.
Get a significant win by making sure dependencies are tree-shakable
To understand how performance improvements can enhance a DoorDash consumer’s conversion rate — from browsing restaurants on the homepage to checking out shopping carts successfully — we wanted to find any low-hanging fruit that could reduce the bundle size and improve website performance quickly. As seen in Figure 3, we started by analyzing DoorDash’s main bundle. We found a library called libphonenumber-js that is duplicated in many components of our internal design system.
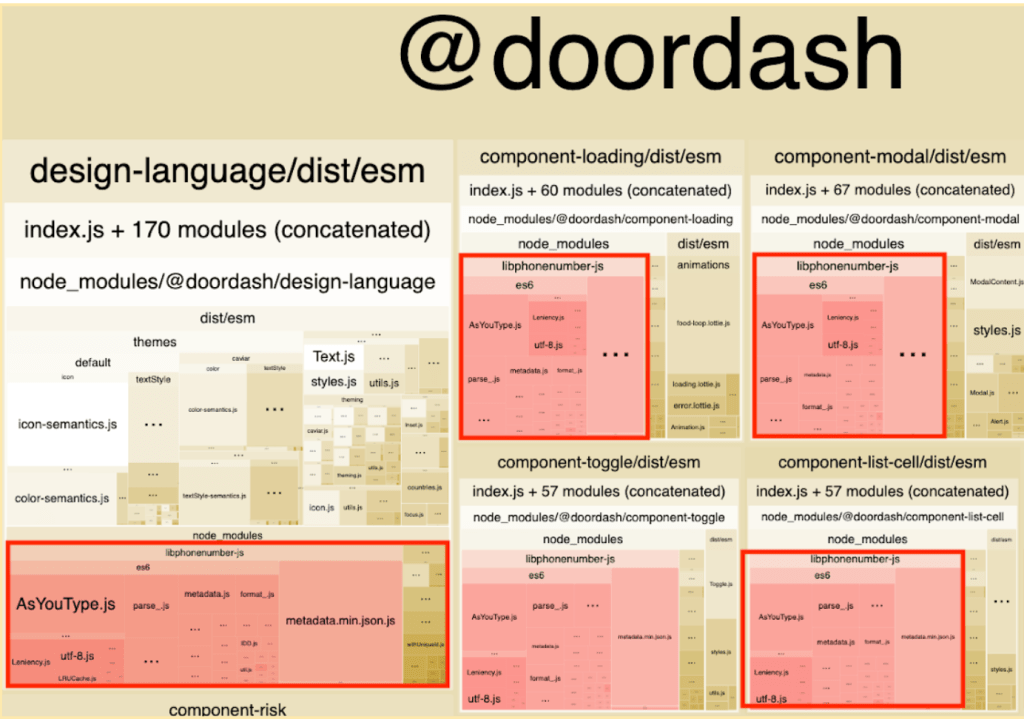
Finding this library was a particularly useful discovery because most of these components don’t use ‘libphonenumber-js’ much, if at all. Instead, libphonenumber-js is inside every design system component because it’s a dependency of the common utility package (@doordash/utilities) in the design system and @doordash/utilities is a dependency of almost all design system components. Although the dependency chain caused the duplicate library to be introduced to each component, it should be tree-shaken during build time. That’s how we found out libphonenumber didn't support tree-shaking until version 1.9.4. In the end, the fix was trivial. We only needed to update the version of `libphonenumber-js` used in the design system and bump the version of design system dependency used in the consumer website repository. This action eliminated 300KB from the main bundle after compression. Following release of this change, we observed a directionally positive conversion impact on web traffic of approximately 0.50% — which at our scale, is significant.
Defer rendering of the DOM elements outside the viewport
Using the Lighthouse tool to audit the DoorDash web page’s performance, we discovered — as shown in Figure 4 — that the website renders more than 5,000 elements, affecting the page’s runtime performance.

The page delegates all of the heavy lifting involved in building the UI to the client-side. The more elements the page has, the more tasks the browser must do, such as recomputing the position and styling of nodes. A large DOM tree in combination with complicated style rules can severely slow rendering.
Users want to see the UI appear as fast as possible when they come to the web page. To load quickly, the page must render fewer elements at first; unfortunately, our web page renders all elements at the same time. To reduce the number of elements that render in the first load, we applied lazy loading to elements below the fold. We wanted to ensure that the page would only render necessary components within the viewport while deferring the rest.
Before applying lazy loading, we had to consider whether or not it might affect our site’s search engine optimization (SEO) rankings. Typically, search engines prefer a site with rich content, but lazy loading defers the loading of content outside of the viewport. If web crawlers visit the website and see less content, our search ranking could suffer. Fortunately, the web page we audited doesn’t need to be crawled and cannot be accessed directly. That means the lazy loading approach did not harm our search ranking, so we were able to apply it to our web page.
To apply lazy loading, we first analyzed the UI to determine those areas that render the most elements in the page. Because the header and category menu are in the viewport when the page first loads and they don’t have many elements, we decided to apply lazy loading only to the curated areas as shown in Figure 5.

We saw significant reductions in loading speed based on First Input Delay (FID) readings. Here are the results after our 20-day experiment:
- FID
- Mobile: 67% improvement (from 145.44ms to 48.46ms)
- Desktop: 46% improvement (from 11.46ms to 6.21ms)
Subscribe for weekly updates
Improve rendering time by reducing API bottleneck
For certain pages at DoorDash, we control various parts of the UI using configurations returned from APIs. These pages need to wait for an initial response before the rendering can begin. Unfortunately, some of these endpoints communicate internally with many different services to create a response for the client, which means it can take longer time to render.
To investigate, we used the performance feature of Chrome DevTools to research the website's performance as shown in Figure 6.
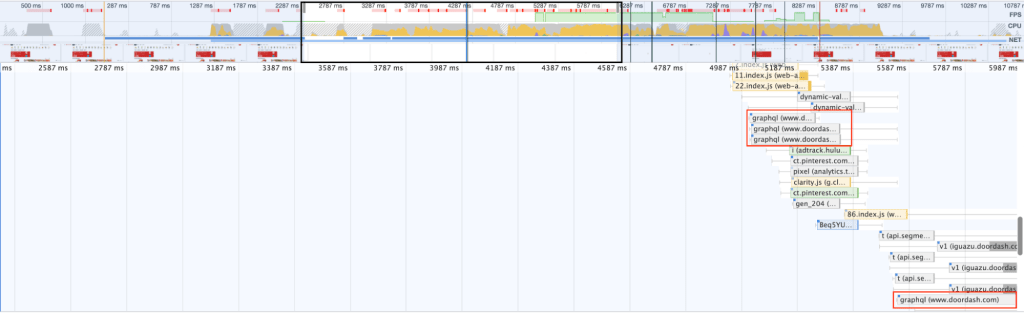
From Figure 6, we noticed that at the initial rendering, there was a four second blank before rendering the contents on the page. Focusing in on the empty renders, we can see that the website makes several API calls. For server configuration-driven UIs, the response time of the configuration is vital for the first paint.
Using Chrome DevTools, we monitored the response time of the main API that returns the UI configuration to verify this. Our results are shown in Figures 7 and 8.
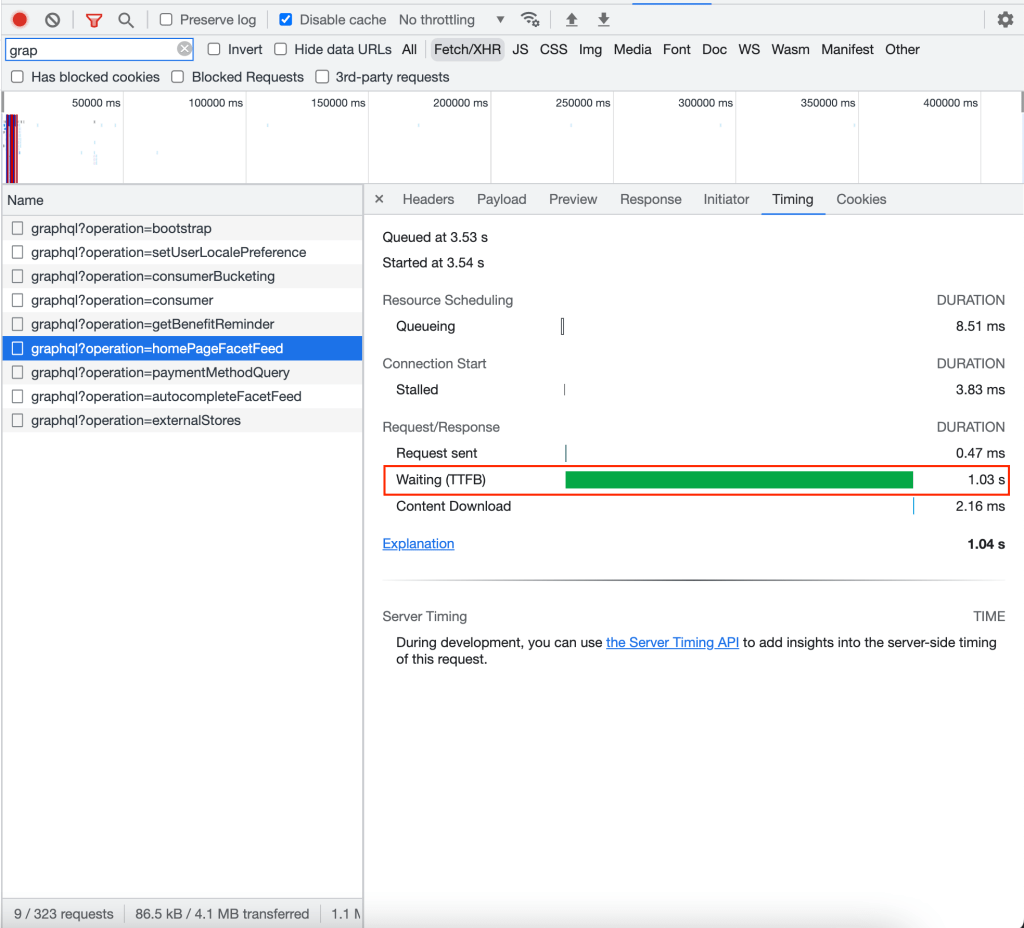

As shown here, the API takes seconds to respond, which defers UI rendering.
Ultimately, we are reminded that we need to measure API response when reviewing performance and some potential areas of improvements for this issue includes:
- Rendering placeholder skeletons to provide a first meaningful paint
- Rendering static contents not driven by API responses for pages where performance is more important
- Making the first configuration request in SSR to provide an accurate first render
Delay loading render-blocking resources
When the user visits the website and before the page is rendered on the screen, it has to wait for synchronously-downloaded resources like CSS stylesheet or JavaScript to load or for the synchronous JavaScript tasks to finish executing. These issues can delay when the user can see the page. By eliminating these render-blocking resources, we may be able to improve the website performance.
Identify render-blocking resources
There are a few ways to identify render-blocking resources:
- Use Lighthouse in Chrome DevTools as shown in Figure 9.

- Check those resources loaded before the “DOMContentLoaded” event as shown in Figure 10.

In the “Waterfall” panel of Chrome DevTools’ network tab, the blue line indicates when the “DOMContentLoaded” event was fired. This event will only be fired when the page’s initial HTML is fully parsed and DOM is built; resources loaded before this event — such as CSS and JavaScript — could potentially block the parsing and rendering process.
Apply async/defer for render-blocking resources
The most common technique to eliminate render-blocking resources is to add the async or defer attribute to the script (for loading JavaScript) and stylesheet (for loading CSS) tags. This tells the browser those resources are not critical so the parser doesn’t have to wait for them to be downloaded before it continues parsing and rendering. This time, we also audited each page of the DoorDash website to make sure the right `async’ or `defer’ attribute is applied to those non-critical resources as shown in Figure 11.

Minimize the negative impact of render-blocking resources
Some CSS and JavaScript might be critical to the current page — which would make them unavoidably render-blocking — but a few techniques can minimize the negative impact.
- Extract critical CSS and inline it inside the `head’ tag
Extract only the CSS actually used in the page and put them inside the `head’ tag to load synchronously, then download the rest of the stylesheet asynchronously. With this technique, the browser doesn’t have to make an additional request to get critical CSS for this page, reducing the render-blocking time by parsing only critical CSS. In DoorDash, we use styled-components to build the UI and it injects critical CSS automatically, which means we didn’t have to make any changes.
Prevent long-running scripts from executing
While a script loaded synchronously can be render-blocking, a script with `async’ attributes applied also can be render-blocking when it finishes loading before the parser process completes. In such a case, the script is executed immediately, blocking the parsing and rendering. As a result, it’s important to avoid putting a long-running script in the `head’ tag. Figure 12 shows a few scripts that we audited.
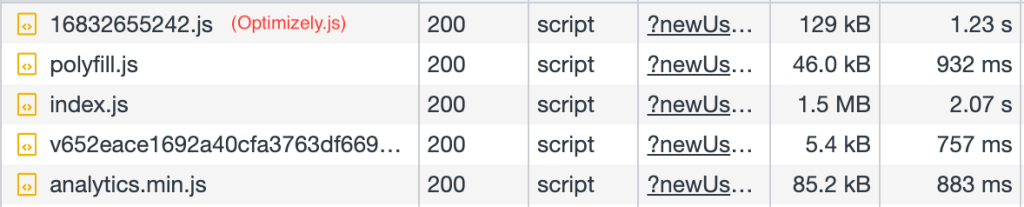
Long-running scripts we audited this time
- Optimizely.js: A synchronously loaded third-party script for A/B testing. The official documentation suggests that it should not be loaded as non-blocking to avoid page flickering, so we didn’t make any changes to this script.
- Analytics.min.js: A wrapper for Segment analytics script, which is loaded asynchronously with the `async’ attribute. We found that we are using Version 1 but Version 2 has already rolled out to improve execution and load time. We opted not to upgrade because we have a company-wide plan to migrate the analytics client to an in-house solution.
- Polyfill.js: All DoorDash web JavaScript polyfills are put in this file, which is loaded synchronously over a lengthy period of time (around 900ms in a non-throttling environment). But this polyfill is shared by all DoorDash websites, so we concluded that it’s too risky to remove anything before proper communication with the relevant teams. Instead, we took no action and will rely on the long cache expiring time for this file, but in the future, we could use tools such as Polyfill.io to load only polyfills needed by the requesting browser.
Although we didn’t find a quick win for this initiative, we believe there is value in auditing the website, listing all potential opportunities to improve in the future.
Apply the right cache policies
When data is cached, a copy is stored where it can be retrieved faster than going to the original source. However, using cached data can be problematic because it may not have the same updates as the source.
There are a lot of data involved in user interactions, including static assets — HTML, CSS, and JavaScript files to render the website, make it interactive, and provide image content and font files — and dynamic content, including user-input data which can be created, updated, read, and deleted in the system. These data could flow through:
- User browser (service worker)
- Application code
- HTTP protocol
- CDN
- Load balancer
- Backend server
- Database
Each component that data passes through creates an opportunity to add a cache to retrieve the data faster than going to the source.
How to audit cached configuration
Configuring caches correctly can enhance website performance drastically. It also can be low-hanging fruit simply to add headers or toggle component configurations in the components we mentioned above. Here are a few techniques to audit the cache configuration.
Check the HTTP cache
To confirm if HTTP caching is working as expected, check the size of each static asset (like JavaScript bundles, images, or fonts) using Chrome DevTools under the “Size” tab as shown in Figure 13.

If those assets are served from “disk cache” or “memory cache,” there may be no issue; the browser is getting them from the cache rather than fetching them from the CDN or server. To dive into how the cache is configured for each asset, check the response header for the values of Cache-Control, Expires, ETag, or Last-Modified.
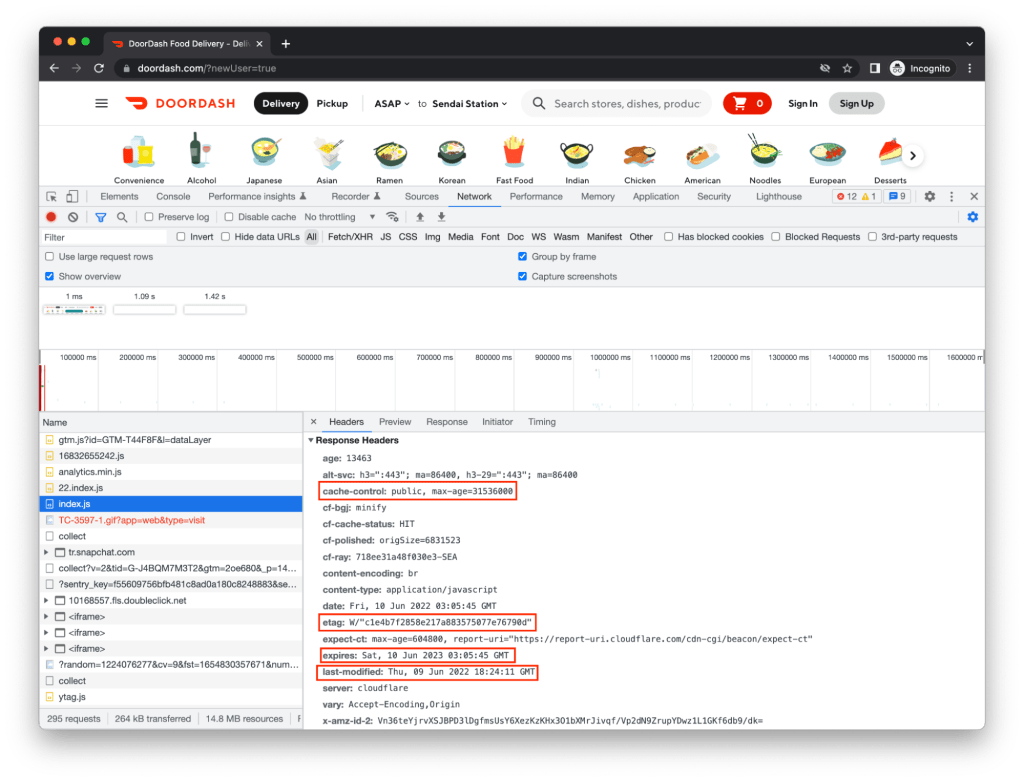
Even if there is no proper cache-related header configured, modern browsers are smart enough to use heuristic freshness to decide if a resource should be cached. Nonetheless, we recommend configuring them explicitly instead of relying on heuristic freshness, which is not deterministic and is highly dependent on the implementation of each browser.
Confirm the cache hit ratio in the CDN
The difference between CDN cache and HTTP cache is that CDN cached assets can be shared between all clients,including the browser, while HTTP cache can only be used by the browser of the current user’s device. To audit the configuration of CDN cache, go to the CDN’s dashboard (in DoorDash we use Cloudflare) to check the cache hit ratio and types of files being cached, as shown in Figure 15.

Like the HTTP cache, CDN cache will respect the cache-control header setting, so if there is a static file which isn’t supposed to be modified frequently but has a high cache-miss ratio, start your investigation by checking the cache-control setting.
Confirm application-level cache
Inside the application code itself, you can cache the data in memory (i.e. store it in a variable) to save the cost of unnecessary API requests or duplicate and complex computation. For example, if you’re using Redux to manage the application state, you may use the reselect library to memoize the deduced state and prevent unnecessary re-computation. Follow these steps to audit your application-level cache configuration:
- Find the application’s computation-heavy or API request-heavy parts
- Navigate away from those pages, then back again
- If the cache is configured for API requests, check the network tab in the dev tool to see if any extra API request is repeated
- If the cache is configured for heavy computation, use a console log to see if there is any unnecessary function call
At DoorDash, we use GraphQL and apollo-client, which support caches for queries (i.e. API requests) with multiple cache strategies. During our audit, we skimmed through the cache strategies of a few main queries to see if the applied policy justifies its use and also looked inside the cache to confirm if the expected data is there with the correct cache key.
Because everything worked as expected, we made no changes, but it was a good opportunity for us to audit our existing cache settings.
Conclusion
DoorDash’s web performance investigation generated many ideas and initiatives, most of which turned out to be dead ends. It’s challenging to apply performance techniques to a big codebase and also risky to do it for high-traffic web pages without thorough coordination and communication across teams. Nonetheless, we found a few quick wins to apply and learned useful lessons from the process, among them:
- Manage Javascript bundle size: Check dependencies for bundle size and use capabilities such as tree-shaking to optimize.
- Defer rendering of the DOM elements outside the viewport: To reduce execution time, only render necessary components within the viewport and make sure optimization does not worsen SEO.
- Improve rendering time by reducing API bottleneck: Measure API response time as well when reviewing web performance because it could be one of the bottlenecks.
- Delay loading render-blocking resources: To limit render-blocking, load non-critical resources asynchronously and prevent long-running scripts.
- Apply the right cache policies: Make sure each layer of the cache is configured correctly with proper caching strategy.
We hope our findings provide starting points for engineers to audit web performance and apply techniques outlined here to improve their site’s performance.
Acknowledgements
Special shoutout to Peter Ju for reviewing and helping us publish this article!


 JoshZhu


 WayneCunningham
Amazing work! Very nice article that is clear and easy to understand