
The DoorDash retail shopping experience mission seeks to combine the best parts of in-person shopping with the power of personalization. While shopping in a physical store has its advantages, a brick-and-mortar store cannot be personalized – the onus is on the consumer to navigate aisles to find what they need. Conversely, a digital shopping experience can be highly personalized. By understanding each consumer's purchasing history, dietary restrictions, favorite brands, and other personalized details, we not only can recommend items that reflect a consumer’s unique shopping needs and preferences, but we can also streamline cart-building. Personalization goes beyond simply curating options for items already on a shopper's list; it also brings a sense of serendipity by unveiling potential new favorites that consumers may not have considered before. Using the power of personalization to craft a delightful retail shopping journey fosters consumer retention by instilling trust that DoorDash truly understands a shopper’s needs and preferences.
In this post, we show how we built a personalized shopping experience for our new business vertical stores, which include grocery, convenience, pets, and alcohol, among many others. Following a high-level overview of our recommendation framework, we home in on the modeling details, the challenges we have encountered along the way, and how we addressed those challenges.
The challenges of building a recommendation model
Building recommendation models for our retail stores is a challenging task that requires a deep understanding of inventory, customer preferences, and shopping context. Unlike our restaurant business, where a typical merchant sells only a few dozen or at most hundreds of dishes or beverages, our new vertical business stores often carry hundreds of thousands of SKUs in thousands of categories. The inventory size and category variety requires our recommendation systems to sift efficiently through a tsunami of choices to recommend relevant options to consumers. Moreover, grocery and retail shoppers tend to have more varied shopping habits and demands than restaurant consumers; while some customers prefer to reorder the same items every week, others may want to explore new products or purchase seasonal items such as Halloween costumes. Additionally, recommendation systems must adapt quickly to dynamic customer preferences that can change significantly depending on the shopping context, such as promotional sales, special events, or even the time of day.
Overall framework
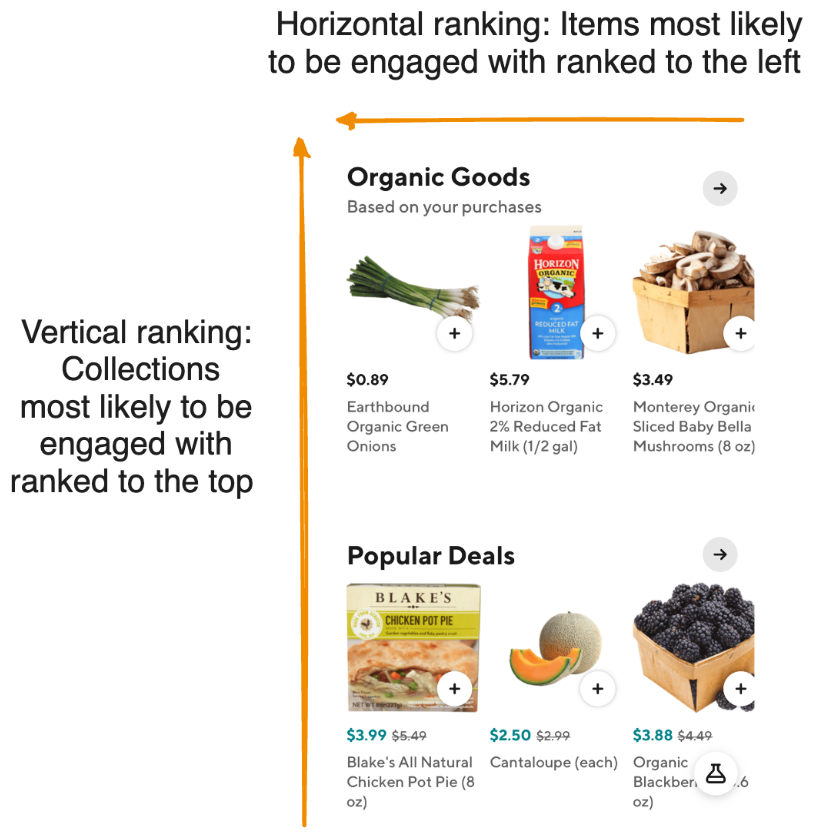
As shown in Figure 1, upon landing on the homepage of a DoorDash retail store, consumers see a variety of themed collections — for example, "Organic Goods" and "Popular Deals" — displayed from top to bottom, each showcasing a selection of items arranged from left to right. If an item is of immediate interest, a consumer can click on the "+" button to add it to their cart. Those seeking more information can click on the item image to view further product details before deciding whether to add the item to the cart. If the initial collections don't appeal to a shopper, they can scroll down vertically to view additional collections. Similarly, if the collection theme is compelling but the visible items are not of interest, consumers can swipe horizontally to see more items to the right.
Before the introduction of ML models, our operations team had to manually curate collections and determine both their vertical positions and the horizontal positions of items within each collection. As DoorDash’s vertical businesses grow, drawing more consumers to these pages, manual retrieval and ranking is no longer tenable, particularly because consumers’ personal needs cannot be taken into consideration. Instead, we built a new framework, as shown in Figure 2, to personalize recommendations for shoppers.
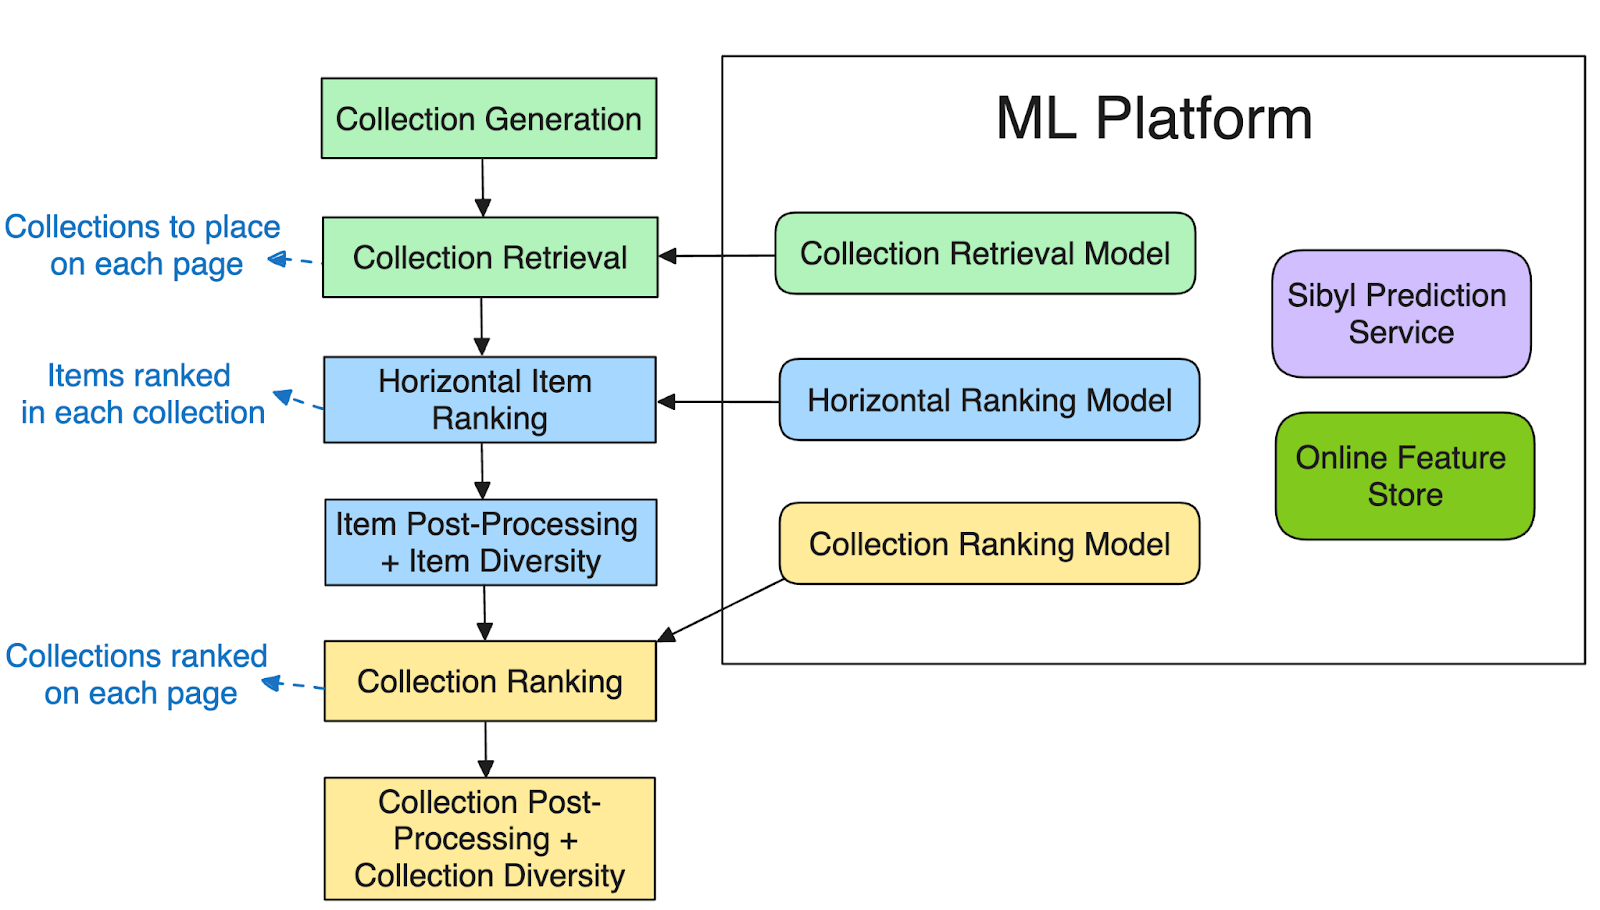
This framework consists of the six components below:
I. Collection generation:
Our collections fall under three main categories, depending on how they are generated.
- Operator-generated collections: Manually curated by operators and usually contain popular items from a merchant, as well as seasonal items or items grouped by a specific theme.
- Rules-based personalized collections: Items selected for each consumer based on their purchase history, for example, new items from a consumer's top purchased brand or item category.
- ML-based personalized collections: Item categories that ML models predict to be highly relevant to the consumer.
II. Collection retrieval:
When serving up a merchant’s page, it can be computationally expensive to fetch all available items in a store and then rank them across all collections. To avoid this hefty cost, we instead use a collection retrieval model to perform a first pass through our large group of collections to determine which ones to show consumers on the first page, second page, and so on. This streamlines fetching and ranking items to a single page at a time.
III. Horizontal item ranking:
After collections are retrieved, we use an item ranker to place items horizontally within each collection; more relevant items appear to the left while less relevant items are pushed to the right.
IV. Item post-processing:
We apply business logic to adjust the models’ rankings. For example, items without photos are down-ranked because consumers are less likely to engage with them. Also down-ranked are items with a high probability of being out of stock, as predicted by a separate model, since such items are less likely to be fulfilled. Intra-collection diversity is also applied to avoid showing similar items in a row — for example, three types of apples in a produce collection.
V. Collection ranking:
After items are ranked and adjusted within each collection, we carry out a second round of fine-ranking within the collections. This ensures that collections with higher average scores for their top K-ranked items appear higher than those with less appealing top K items.
VI. Collection post-processing:
In a similar vein to item post-processing, we also apply business logic to finalizing collections. One example is deduplicating items across collections so that consumers do not encounter highly similar items from one collection to another. We also implement inter-collection diversity to alleviate the grouping of collections that contain similar items.
Subscribe for weekly updates
ML model deep dive
Collection retrieval
The collection retrieval model, as shown in Figure 3, is one of the key components of store page personalization. It determines which collections are shown to consumers on each page. The model objective is to predict the probability that a consumer will engage with a given collection, for example by clicking or adding items to the cart.
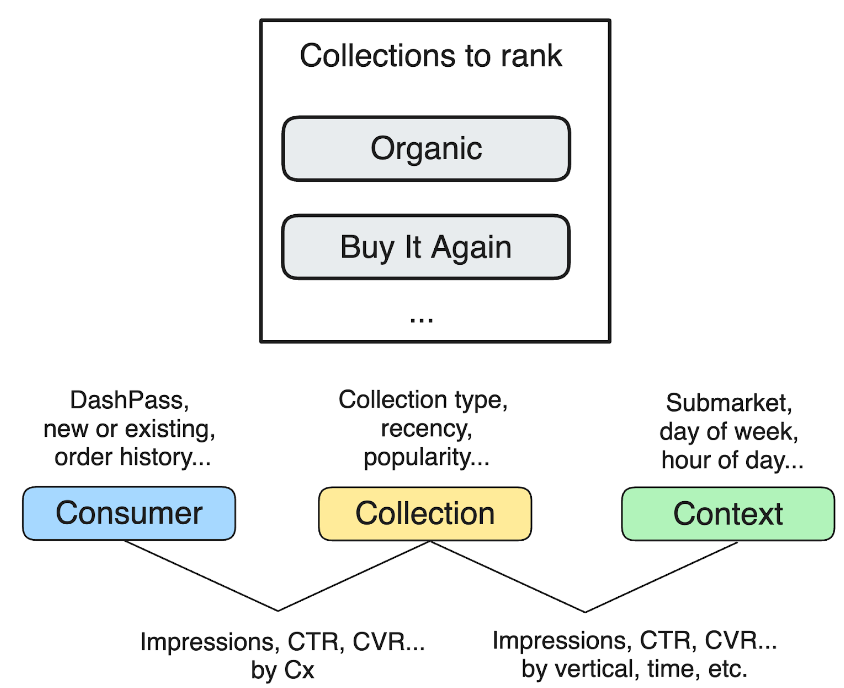
The collection retrieval model considers the following features:
- Popularity of collections, which can be determined in various ways, such as through a high click-through rate (CTR), a large number of clicks, or a high subtotal of orders from items in the collection, among other factors.
- Consumer features, such as whether the consumer has a DashPass subscription, whether they are a new or power user, or how many orders they have placed previously.
- Past consumer engagement with this collection, which can be measured by metrics such as CTR, add-to-cart rates, conversion rates, and subtotals, which may indicate future engagement between the consumer and similar collections.
- Past consumer engagement with items from this collection; consumers may interact with the same items from different stores or in different collections. Consumer item engagement from all surfaces — for example, clicks from search results or clicks from category pages — are used as input features for the collection retrieval model.
- Context features, including such things as time of day, day of the week, store type, and geolocation, among other factors.
Item ranking
An item ranking model determines the horizontal order of items within a collection. We started with a model that predicts CTR because click events contain rich information about consumer preferences and are highly correlated with our business North Stars, including add-to-cart and conversion. We quickly found, however, that optimizing for clicks had certain drawbacks. Models that optimize for CTR tend to up-rank niche items with high historical CTR that nonetheless only appeal to a small group of shoppers, while other items with frequent clicks are rarely added to the cart, known as a click-to-ATC rate. These problems were greatly mitigated by applying higher weights on positive samples where a click event is followed by adding the item to the cart and, ultimately, conversion.
Features of the item ranking model can be divided into three major categories:
- Consumers’ past engagement on this item
- Item attributes, including price, discounts, brand, product categories, and popularity
- Consumer features, such as category preference, dietary restrictions, and price sensitivity
In addition to traditional numerical and categorical feature types, we also used consumer and item semantic embeddings developed by the DoorDash ML team, which offer a richer representation of our consumers and items beyond the dense features included above.
Addressing position bias
As with other ranking models, DoorDash’s personalized rankers are affected by position bias. In fact, this problem becomes more significant because of the limited real estate in our consumer app. On most mobile devices, consumers can only see the first three items in each collection without having to scroll to the right. As shown in Figure 4, position bias causes a decline in CTR — number of clicks/number of impressions — after those first three items. As consumers are required to scroll manually to explore more items, overall item impression drops suddenly in the fourth position, leading to a significant CTR increase from the third to the fourth item in each collection (item card positions are 0-indexed).
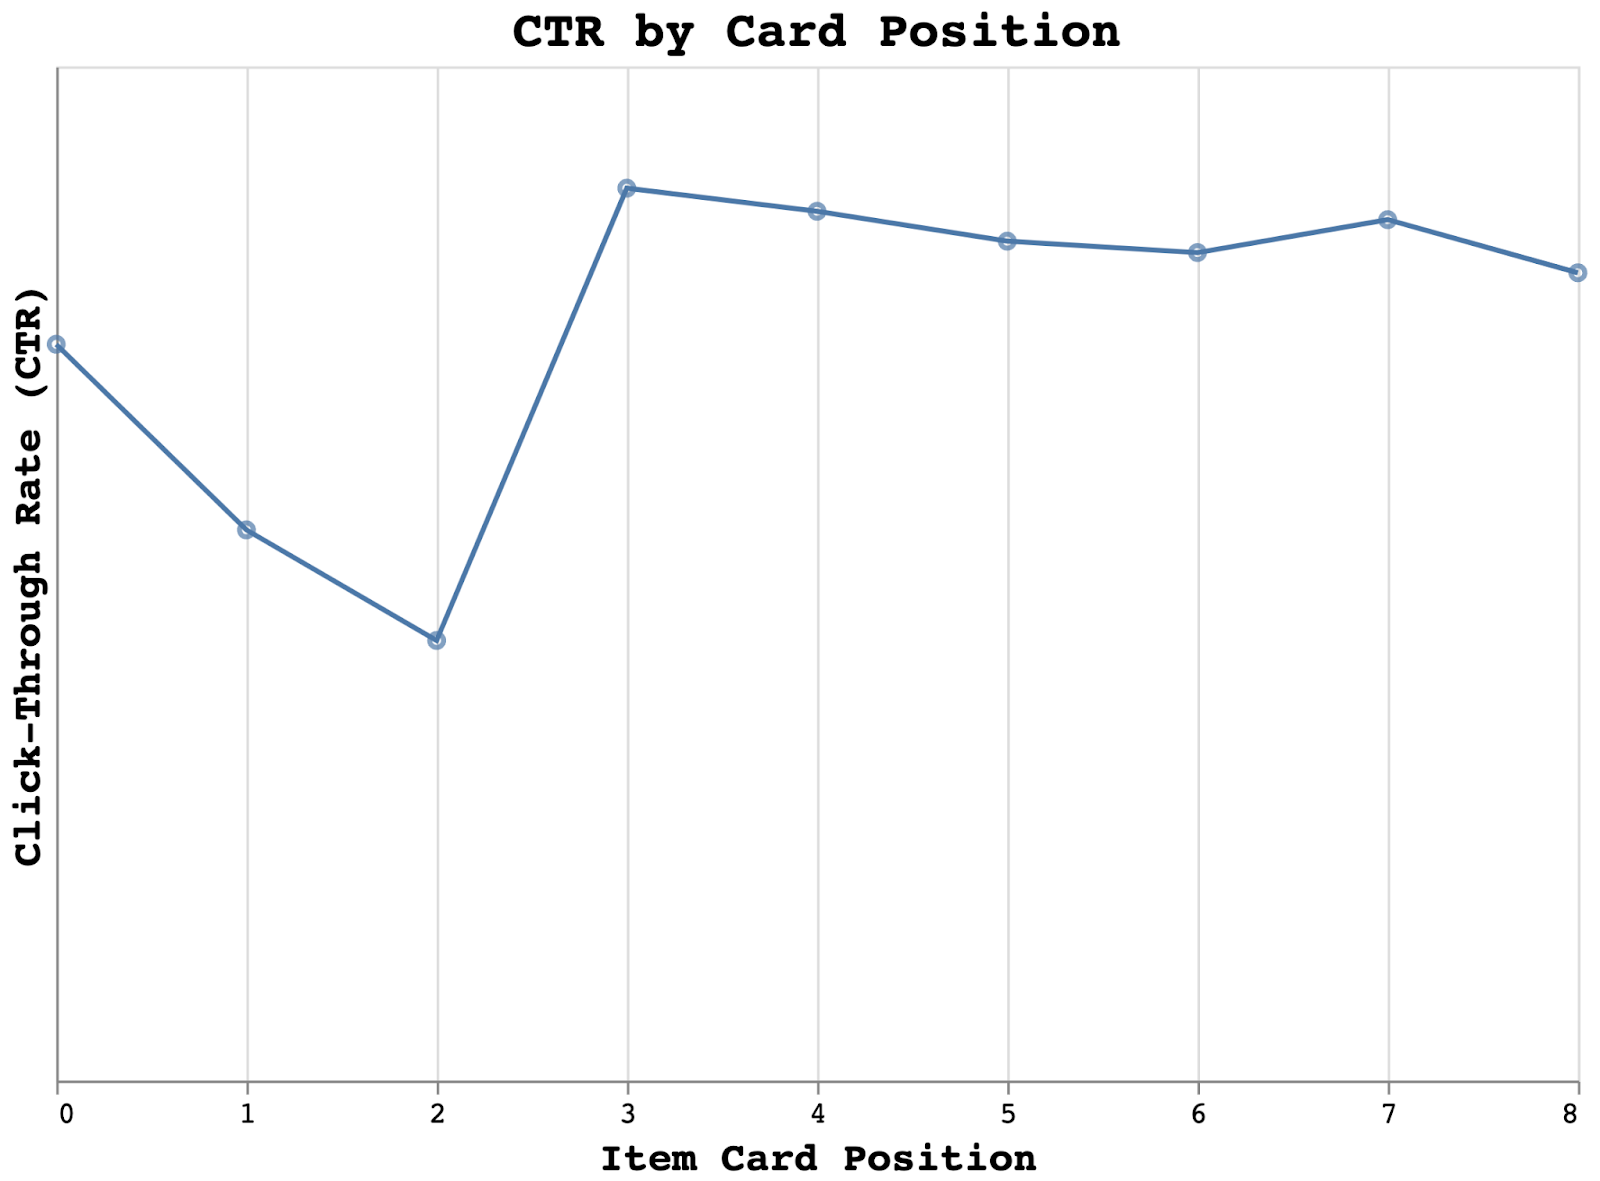
We incorporated item positions as a key feature in our model to account for the impact of item positions on CTR. Because positions vary across varying product surfaces, we included the product surface as an additional feature. During the training phase, the model learns how item positions and product surfaces collectively impact ranking. During inference, we set the item position value to 0, representing the first position, and the product surface to the actual surface where the model is called to make predictions.
Diversifying our recommendations
Ordering items and collections based solely on model scores often leads to clusters of similar items horizontally and similar collections vertically because they exhibit similar model scores. This lack of diversity does not provide an optimal experience for shoppers, nor does it take full advantage of a store’s page to delight customers with fresh discoveries. To diversify our recommendations, we applied maximal marginal relevance to both items and collections after the ranking stage. Take item diversification as an example: Given the item set I, which includes all previously selected items (initially a blank item set), we aim to find the next item j that maximizes the objective function O(j, I), which balances item score and similarity:
O(j,I) = Sj -⍺· sim(j, I)
where Sj is the predicted item core from the ranking model and the similarity metric sim(j, I) is defined based on item attributes such as categories and brands. The value ⍺ is determined via online experiments. This approach is similarly applied to collection diversification.
In backend processing, this technique is applied as a post-ranking step following the horizontal and vertical ranking of collections. More specifically, horizontal diversification — within a collection — is carried out after items are ranked, with the similarity calculation applied at the product category level. Collections are initially diversified at the store level, after which pagination is used to determine which collections are currently served in view and then diversification occurs at the page level. Collection similarity is calculated by aggregating item taxonomy similarity per collection.
Future personalization goals
While we have detailed how ML solutions are helping DoorDash to recommend relevant and diverse items to consumers from a vast inventory spanning thousands of categories, our ML team also is incorporating restaurant order histories to inform grocery recommendations to individual consumers. For example, a frequent vegan restaurant patron might appreciate curated vegan selections in our grocery stores. We plan to use consumer behavior sequences as features to better capture users’ short-term and long-term interests. On the model architecture front, we are moving toward MTML (multi-task multi-label) architectures to adapt to multiple product surfaces and optimize for complex modeling objectives. Ultimately, we're looking to implement real-time features capturing consumer behaviors within a session, for example items currently in the cart and search queries in the past few minutes, to make personalization more timely and context-aware.
Acknowledgments
Special thanks to Meng Chen, Shi Wang, Talia Stadtmauer, Vivek Paharia, Andre Jacobovitz, Yucong Ji, Jennifer Yunus, Sudeep Das, and Kurt Smith who all worked together to make this exciting work happen!


